Dave Nguyen

Product Designer

Projects

Gallery

Gallery

About

About

Redesigning How Obagi
Delivers Skin Insights

Obagi

·

2025

Back

Back

Back

Context

Context

Context

Problem

Problem

Problem

Process

Process

Process

Insight

Insight

Insight

Solution

Solution

Solution

Storytelling

Storytelling

Storytelling

Decision

Decision

Decision

Reflection

Reflection

Reflection

Role

UX & UI Designer

Team

5 members

Timeline

3 months
June to August 2025

Tools

Figma
FigJam
Rive

Context

This is a 0-to-1 skin scanning experience for a clinical skincare brand.

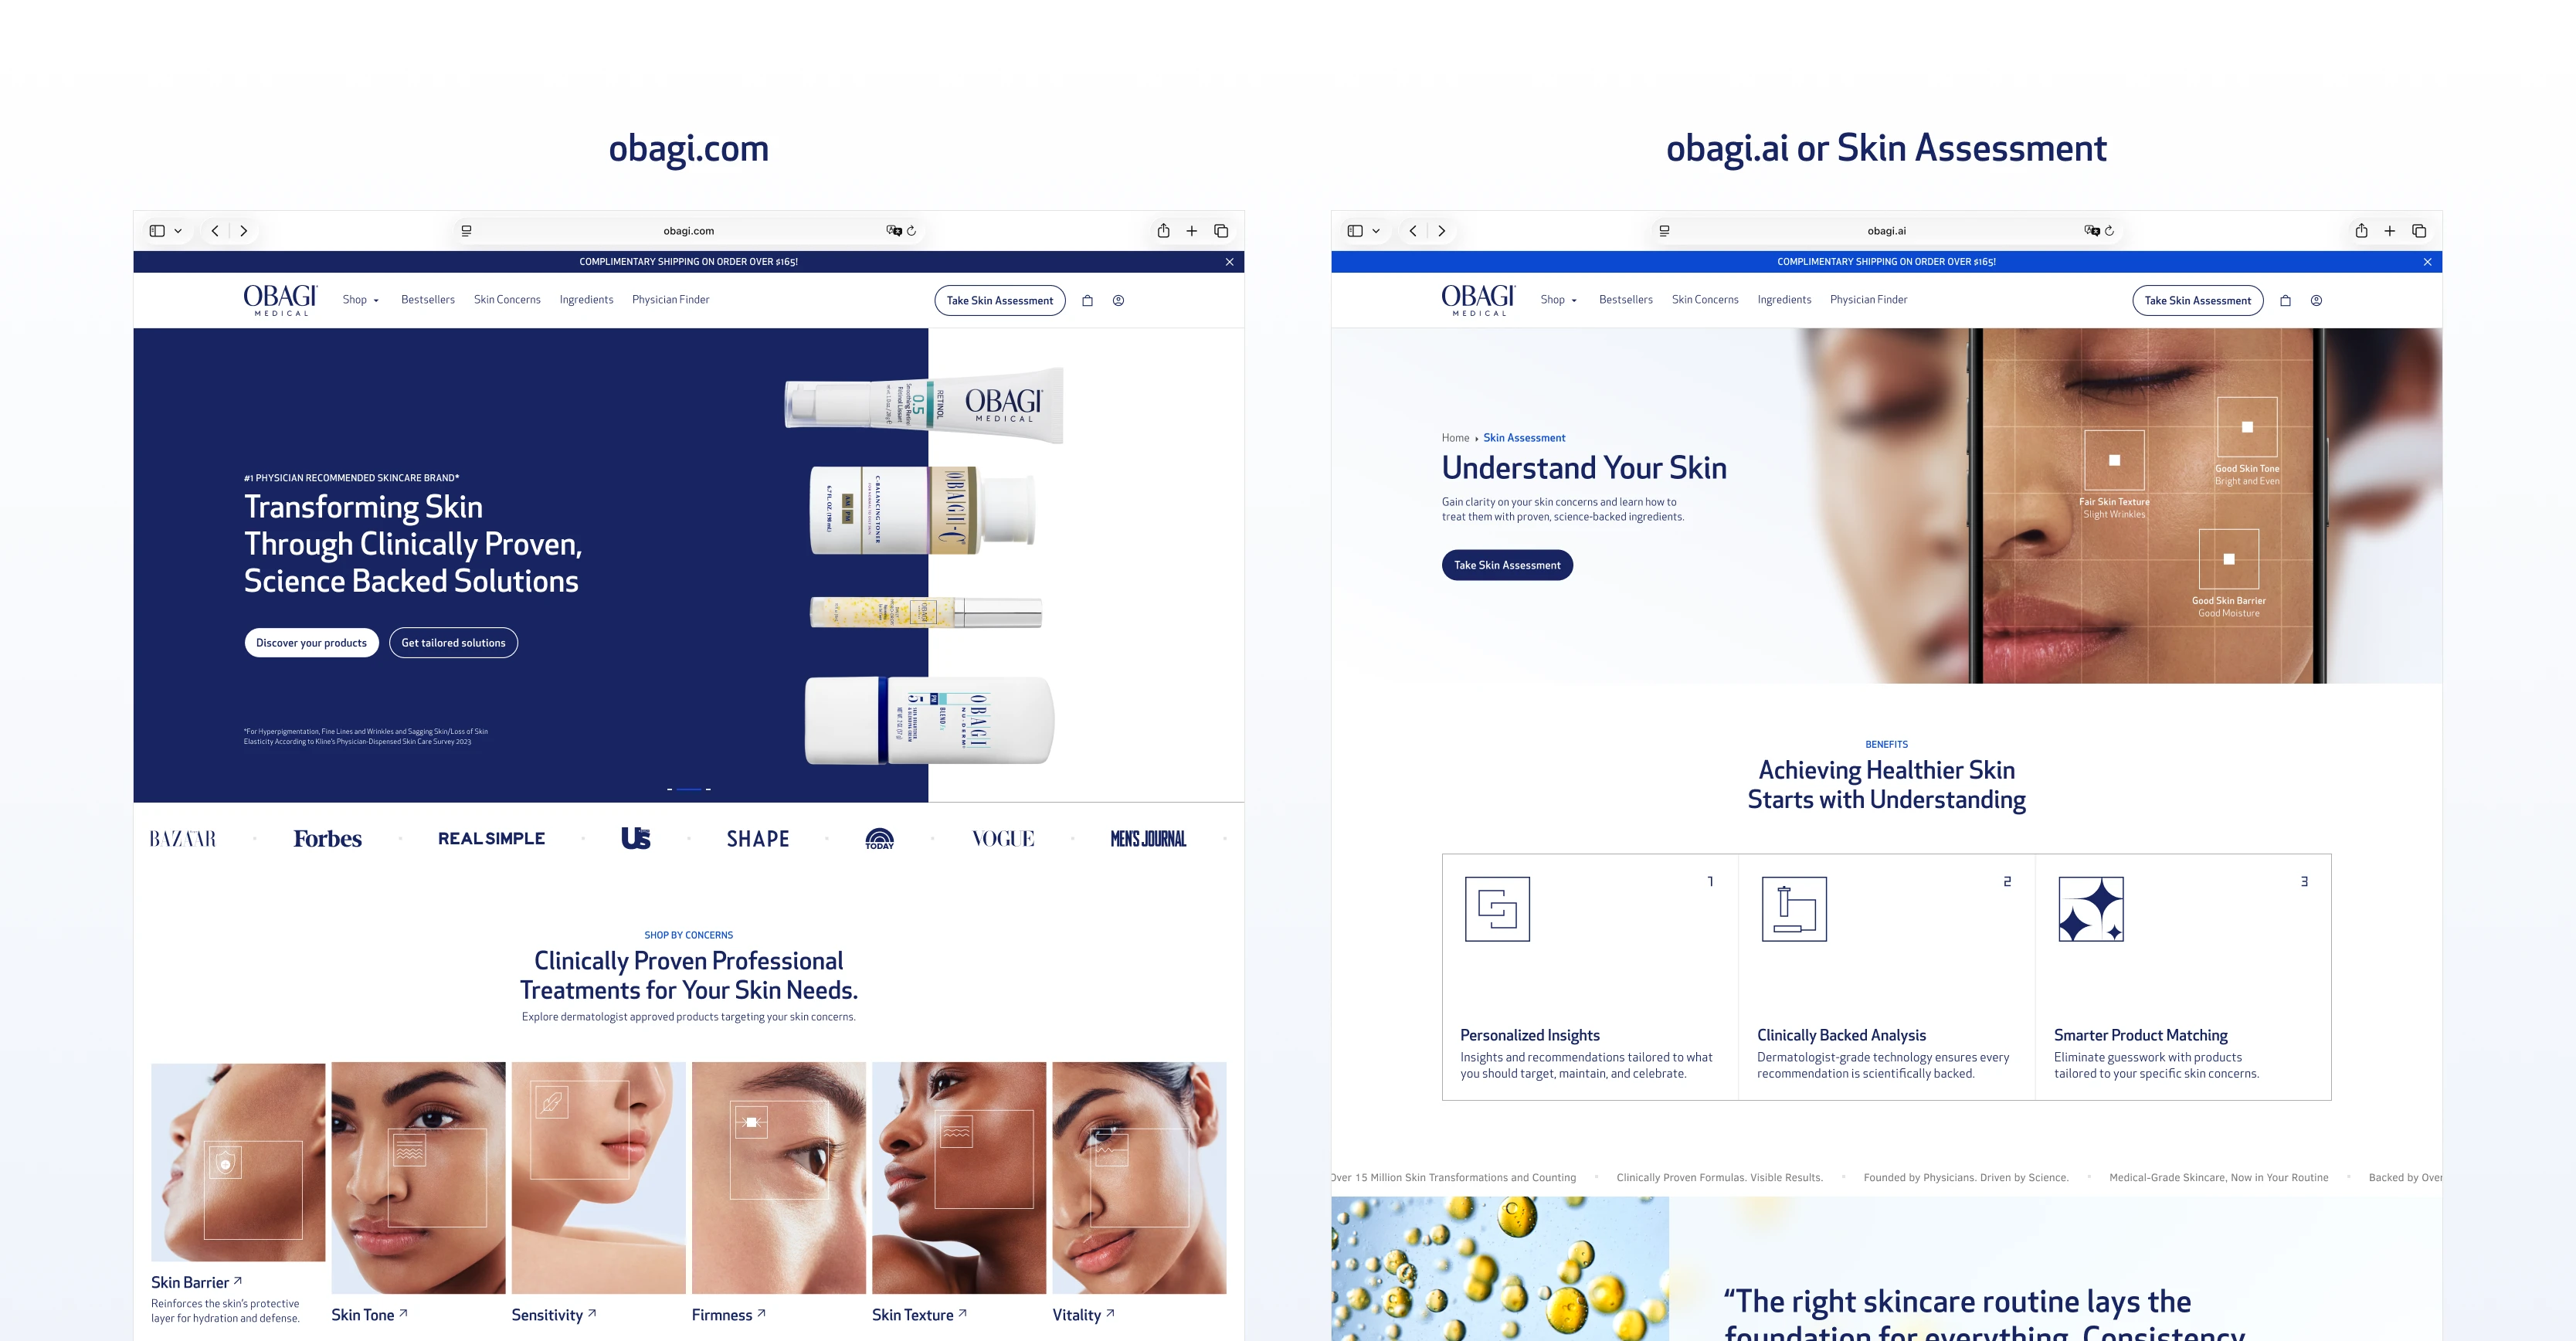
Obagi is a professional-grade skincare brand known for its clinical authority. This project was a 0-to-1 build: a web-based skin scanning experience where users hold up their camera to scan their face, and the system analyzes their skin data to recommend products tailored to their specific conditions.

Obagi case study, image 1
Obagi case study, image 2

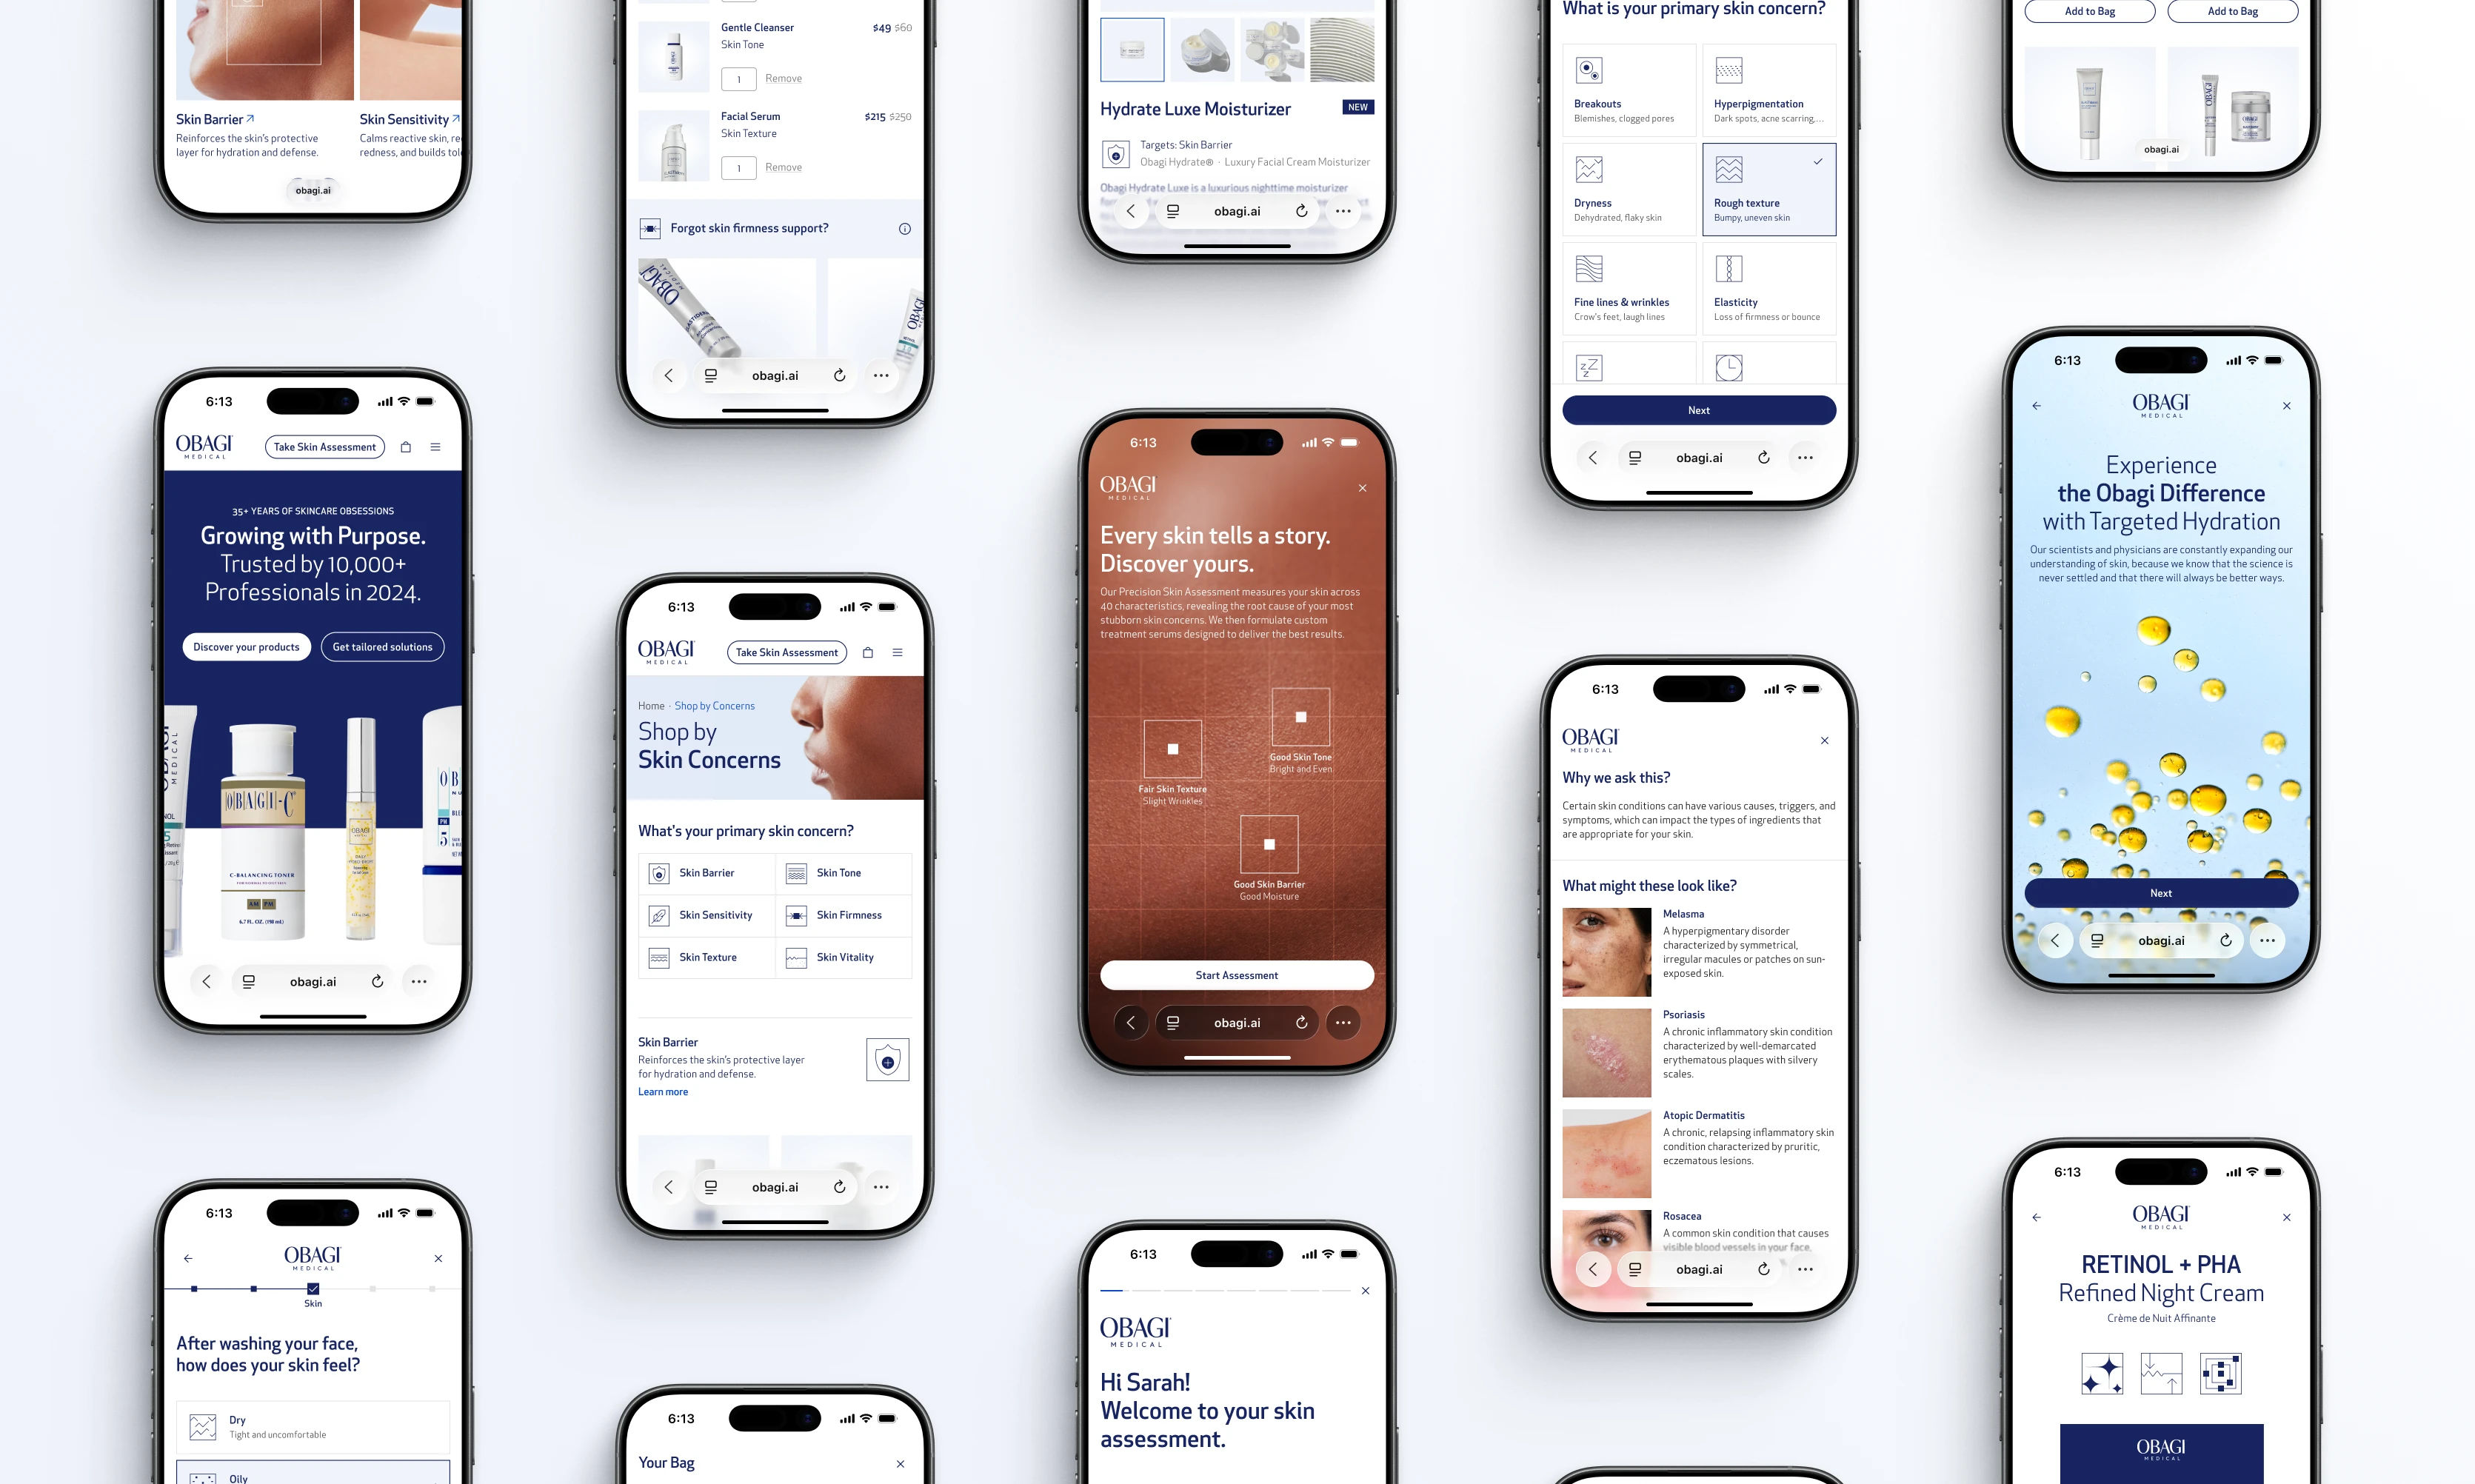
I owned the UX/UI design across the entire experience including the home page, account pages, diagnostic flow, quiz, cart, product detail pages, and the skin report. I built the 200-component design system from scratch, created the user flows, and designed the UX workshops.
Obagi case study, image 3
Obagi case study, image 4

The project was sunsetted before launch due to strategic and legal decisions around the dermatologist layer, not design. The work reached hi-fi, was dev-ready, and was hosted in a staging environment.

This case study focuses on the skin report, the moment after the assessment where users receive their diagnosis and product recommendations.
Obagi case study, image 5
Obagi case study, image 6

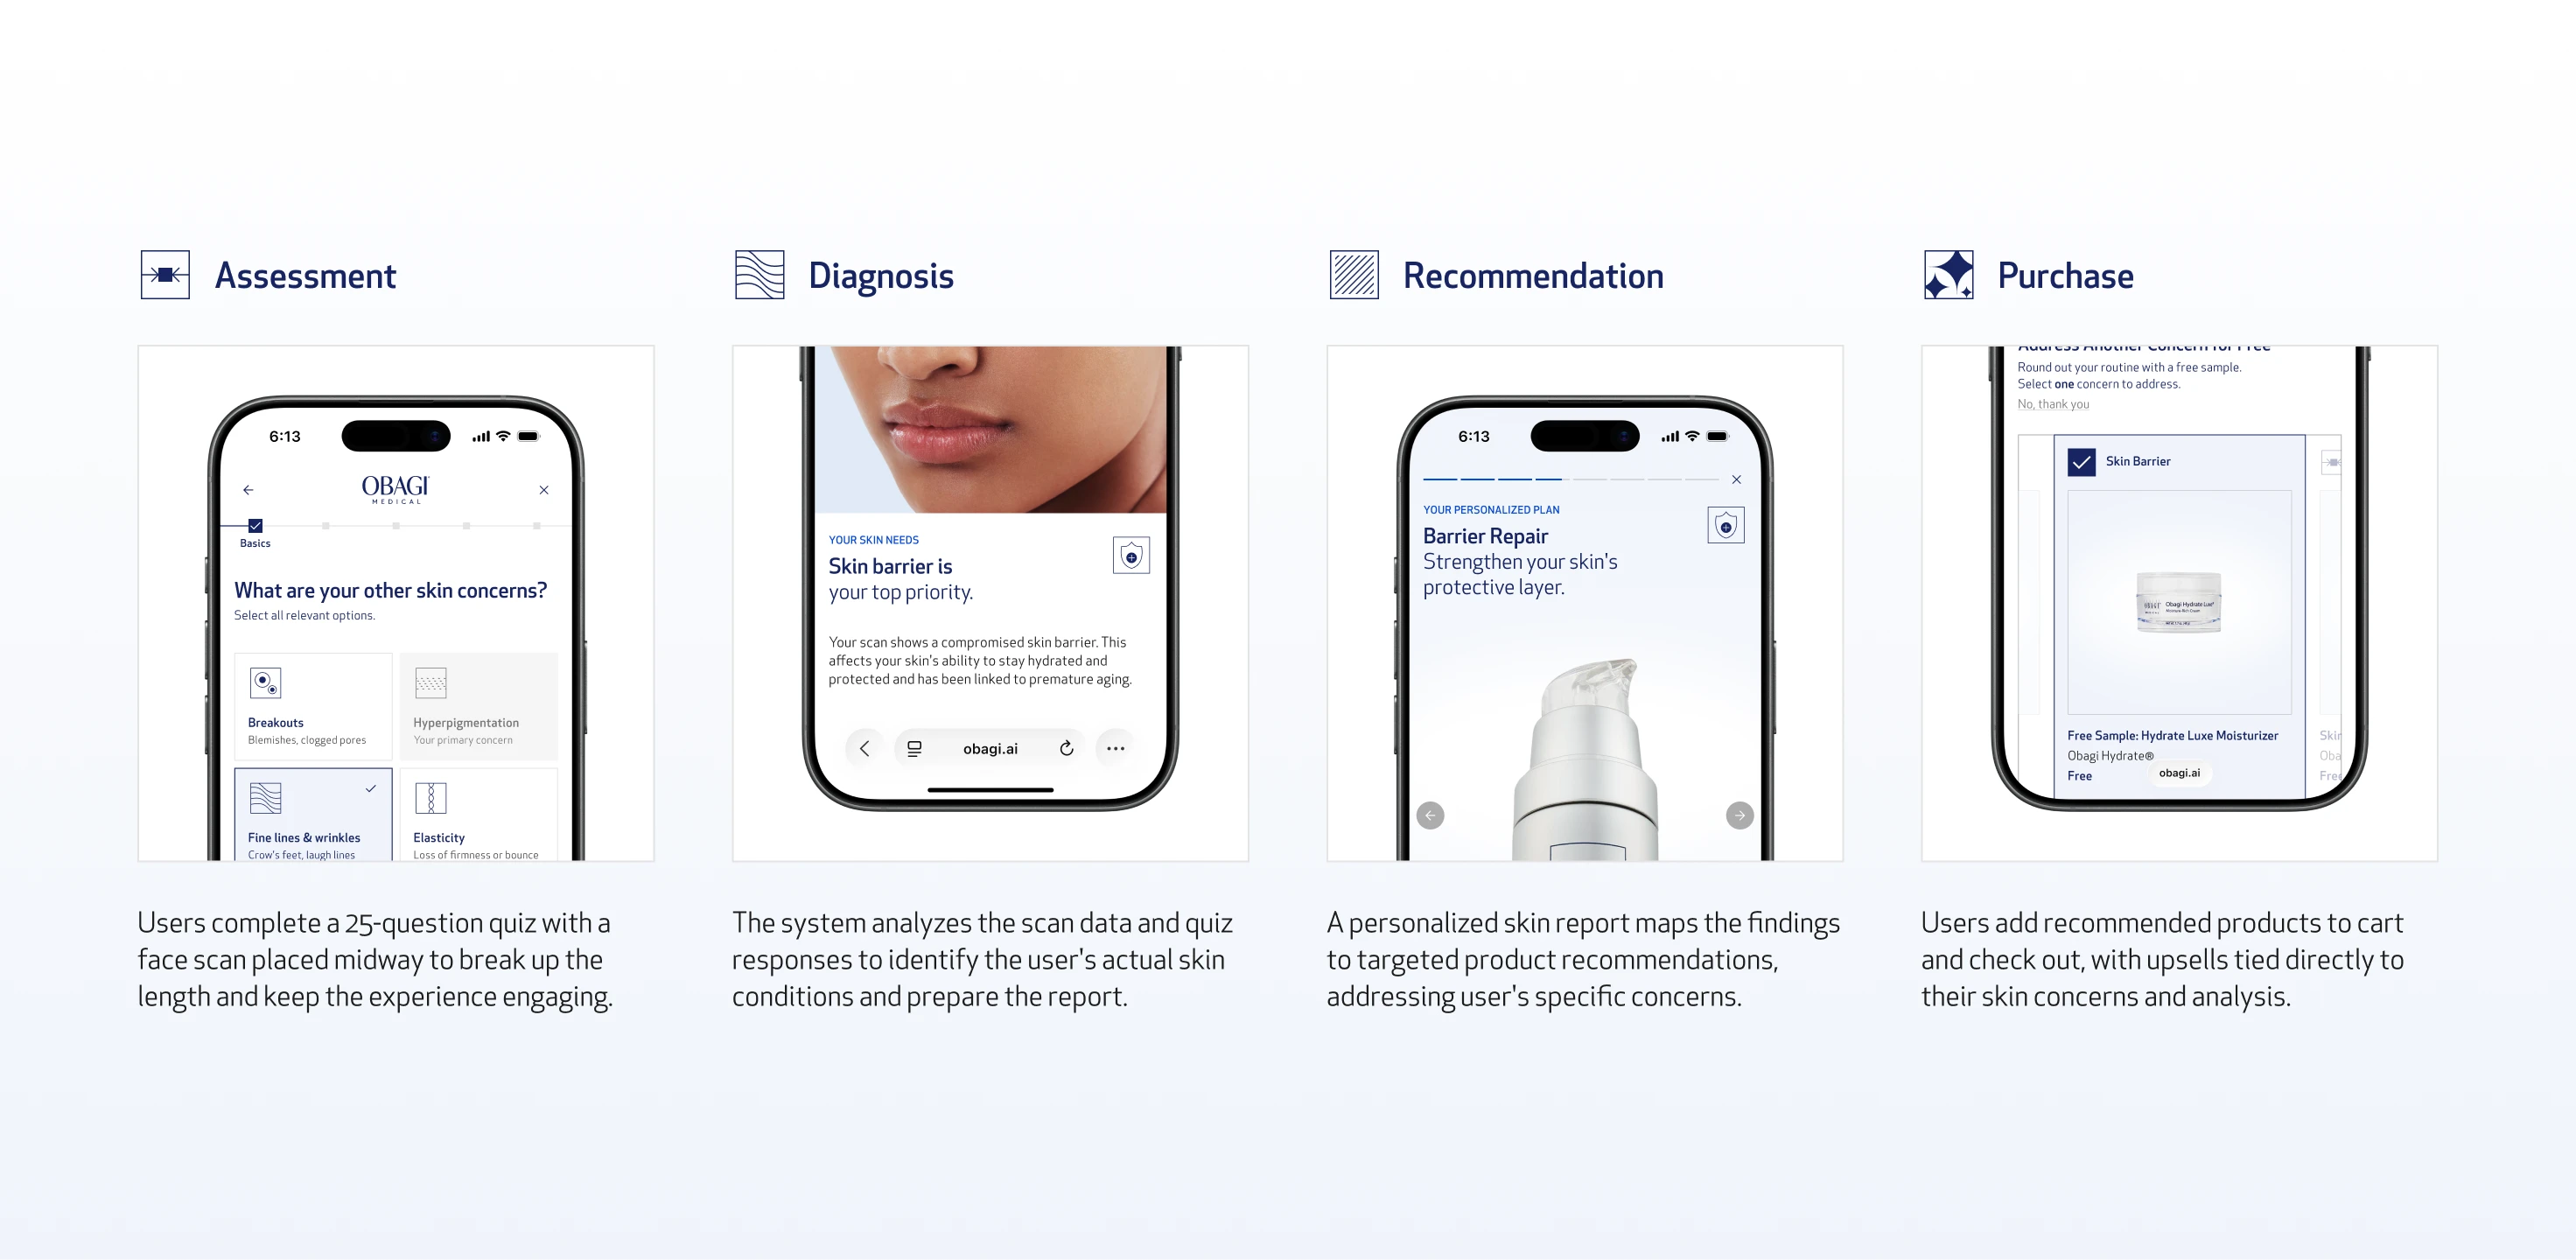
Two Entry Points

The experience has two entry points: obagi.ai, and a dedicated section embedded into obagi.com for users who arrive through the existing site. Both lead into the same four-stage flow:
Obagi case study, image 7
Obagi case study, image 8

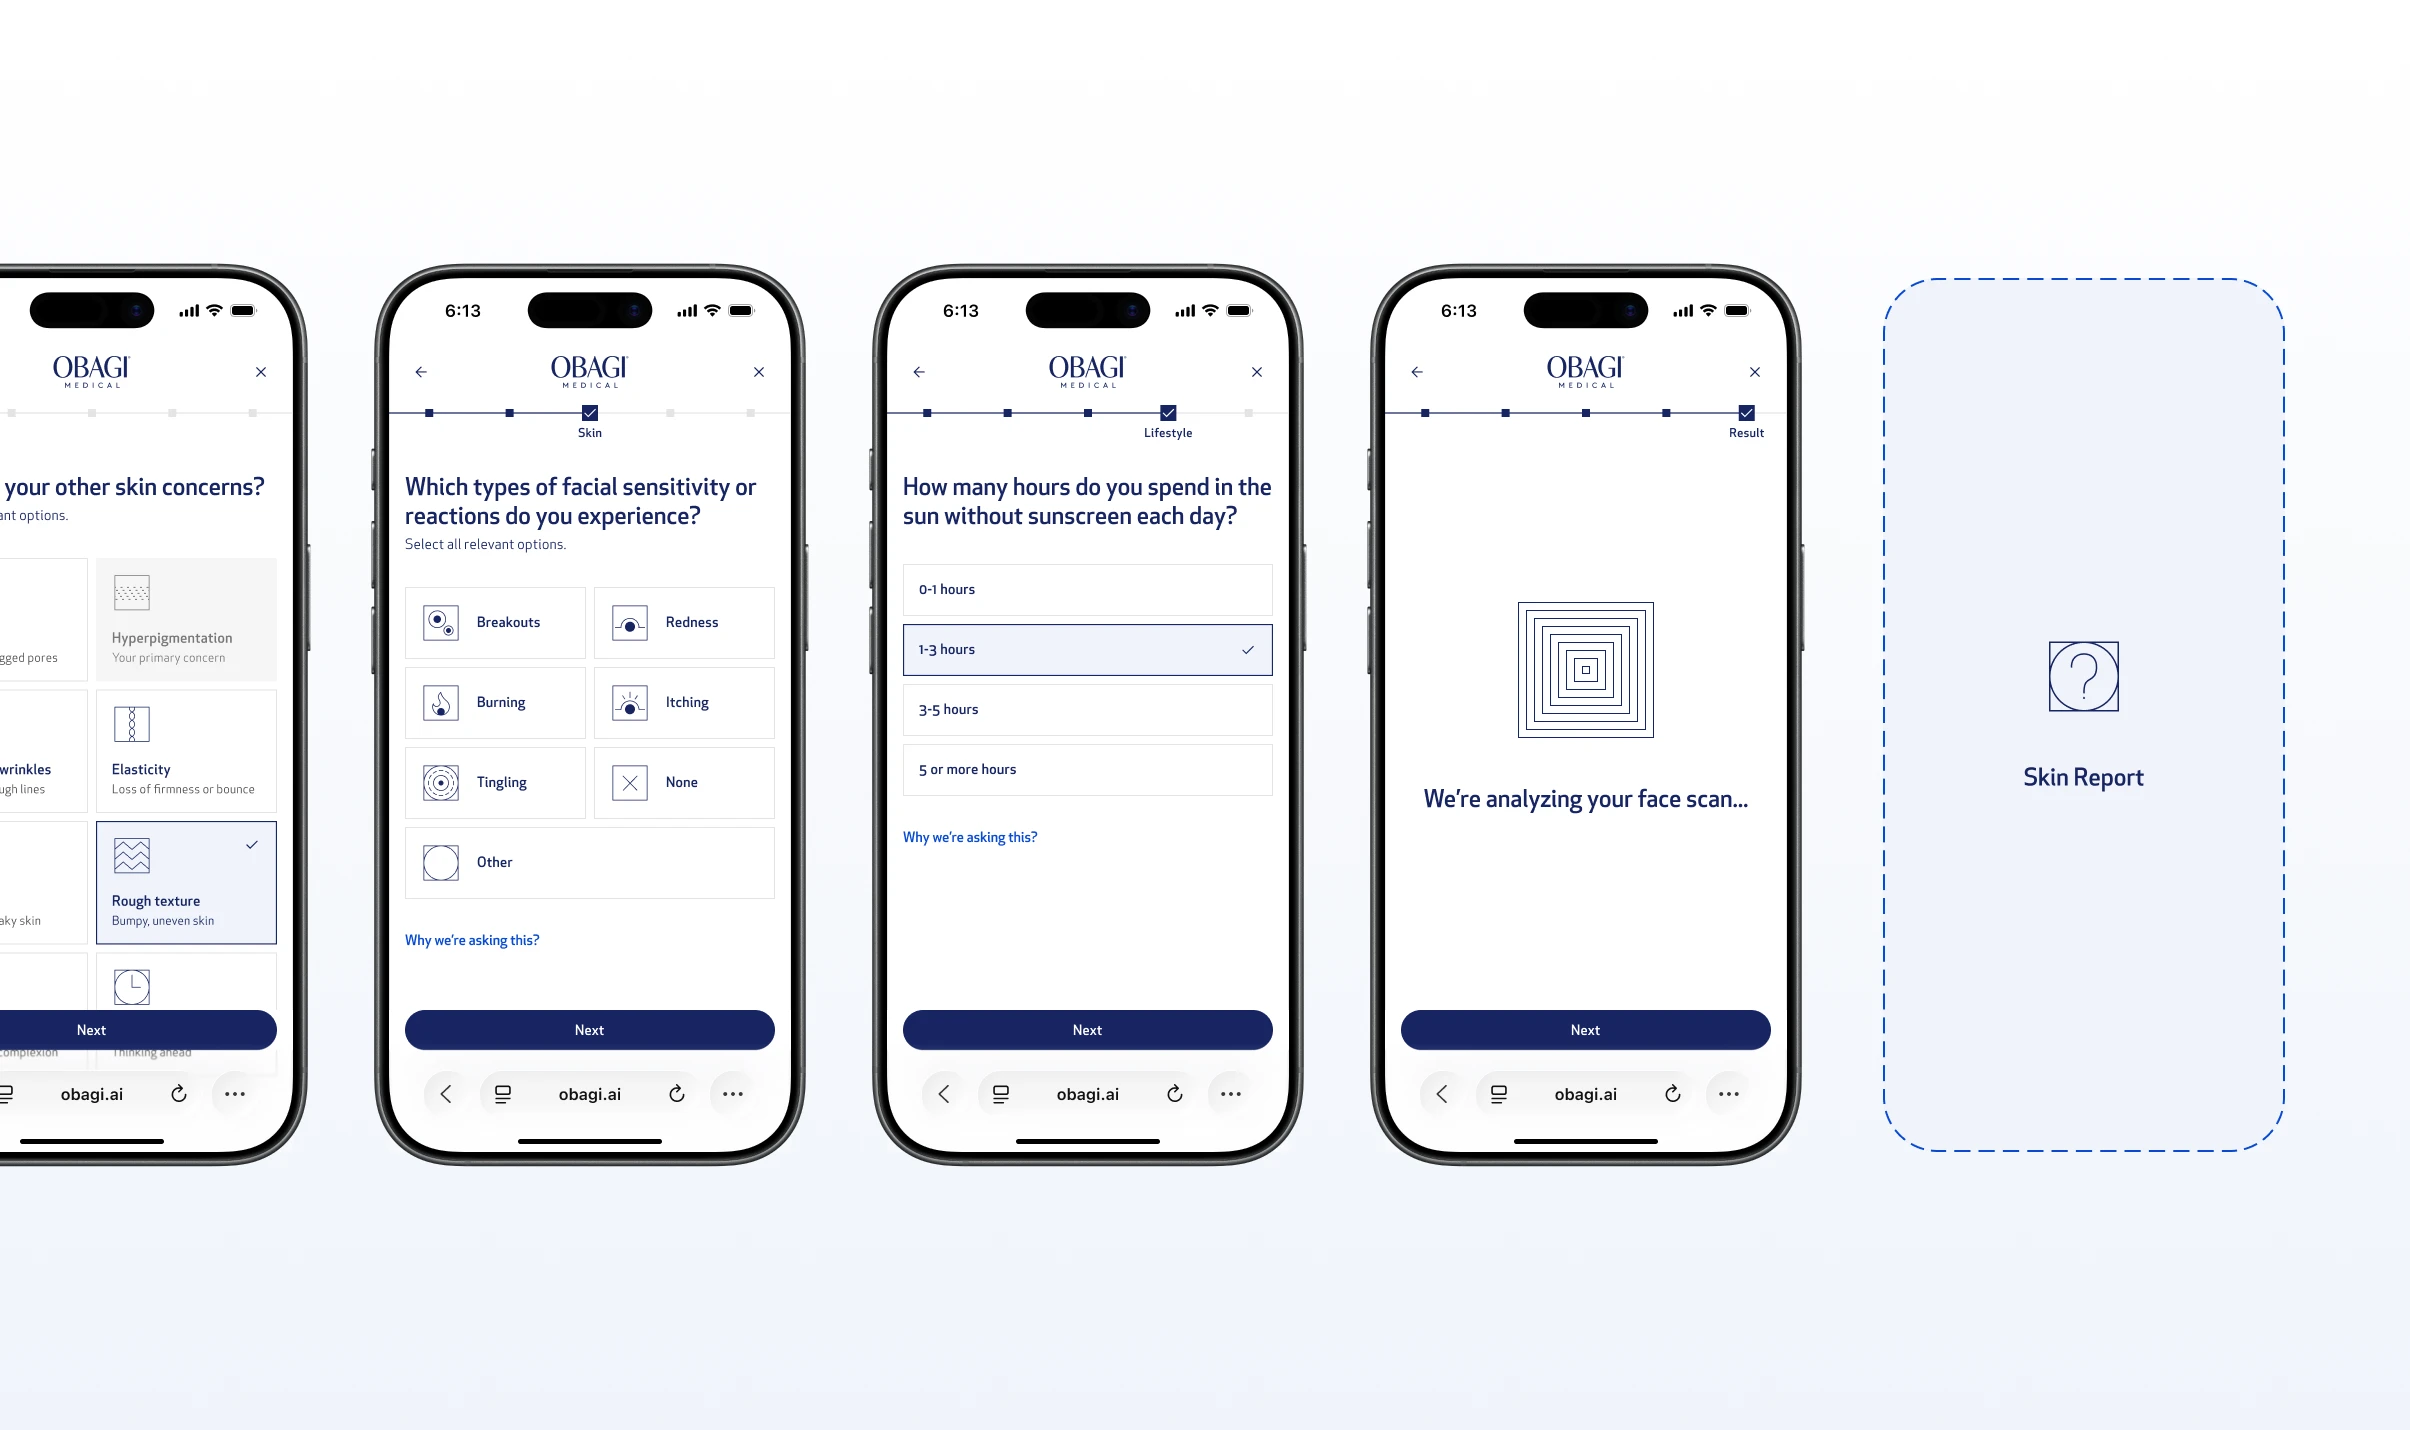
Skin Assessments Flow

01

Assessment

a 25-question assessment quiz, with a face scan in the middle, breaking up the length and keeping engagement throughout.

02

Diagnosis

the system analyzes the scan data and quiz responses to identify the user's actual skin conditions.

03

Recommendation

the skin report delivers the findings and maps them directly to a personalized product recommendation.

04

Purchase

product recommendations flow directly into cart and checkout, with upsell tied to the user's specific skin findings.

Problem

Nobody reads a skin report and that's a conversion problem.

After completing the face scan and a 25-question skin assessment, users land on their skin report. This is the most important moment in the entire journey, the payoff of everything they just did.
Obagi case study, image 9
Obagi case study, image 10

Skin Quiz & Skin Report

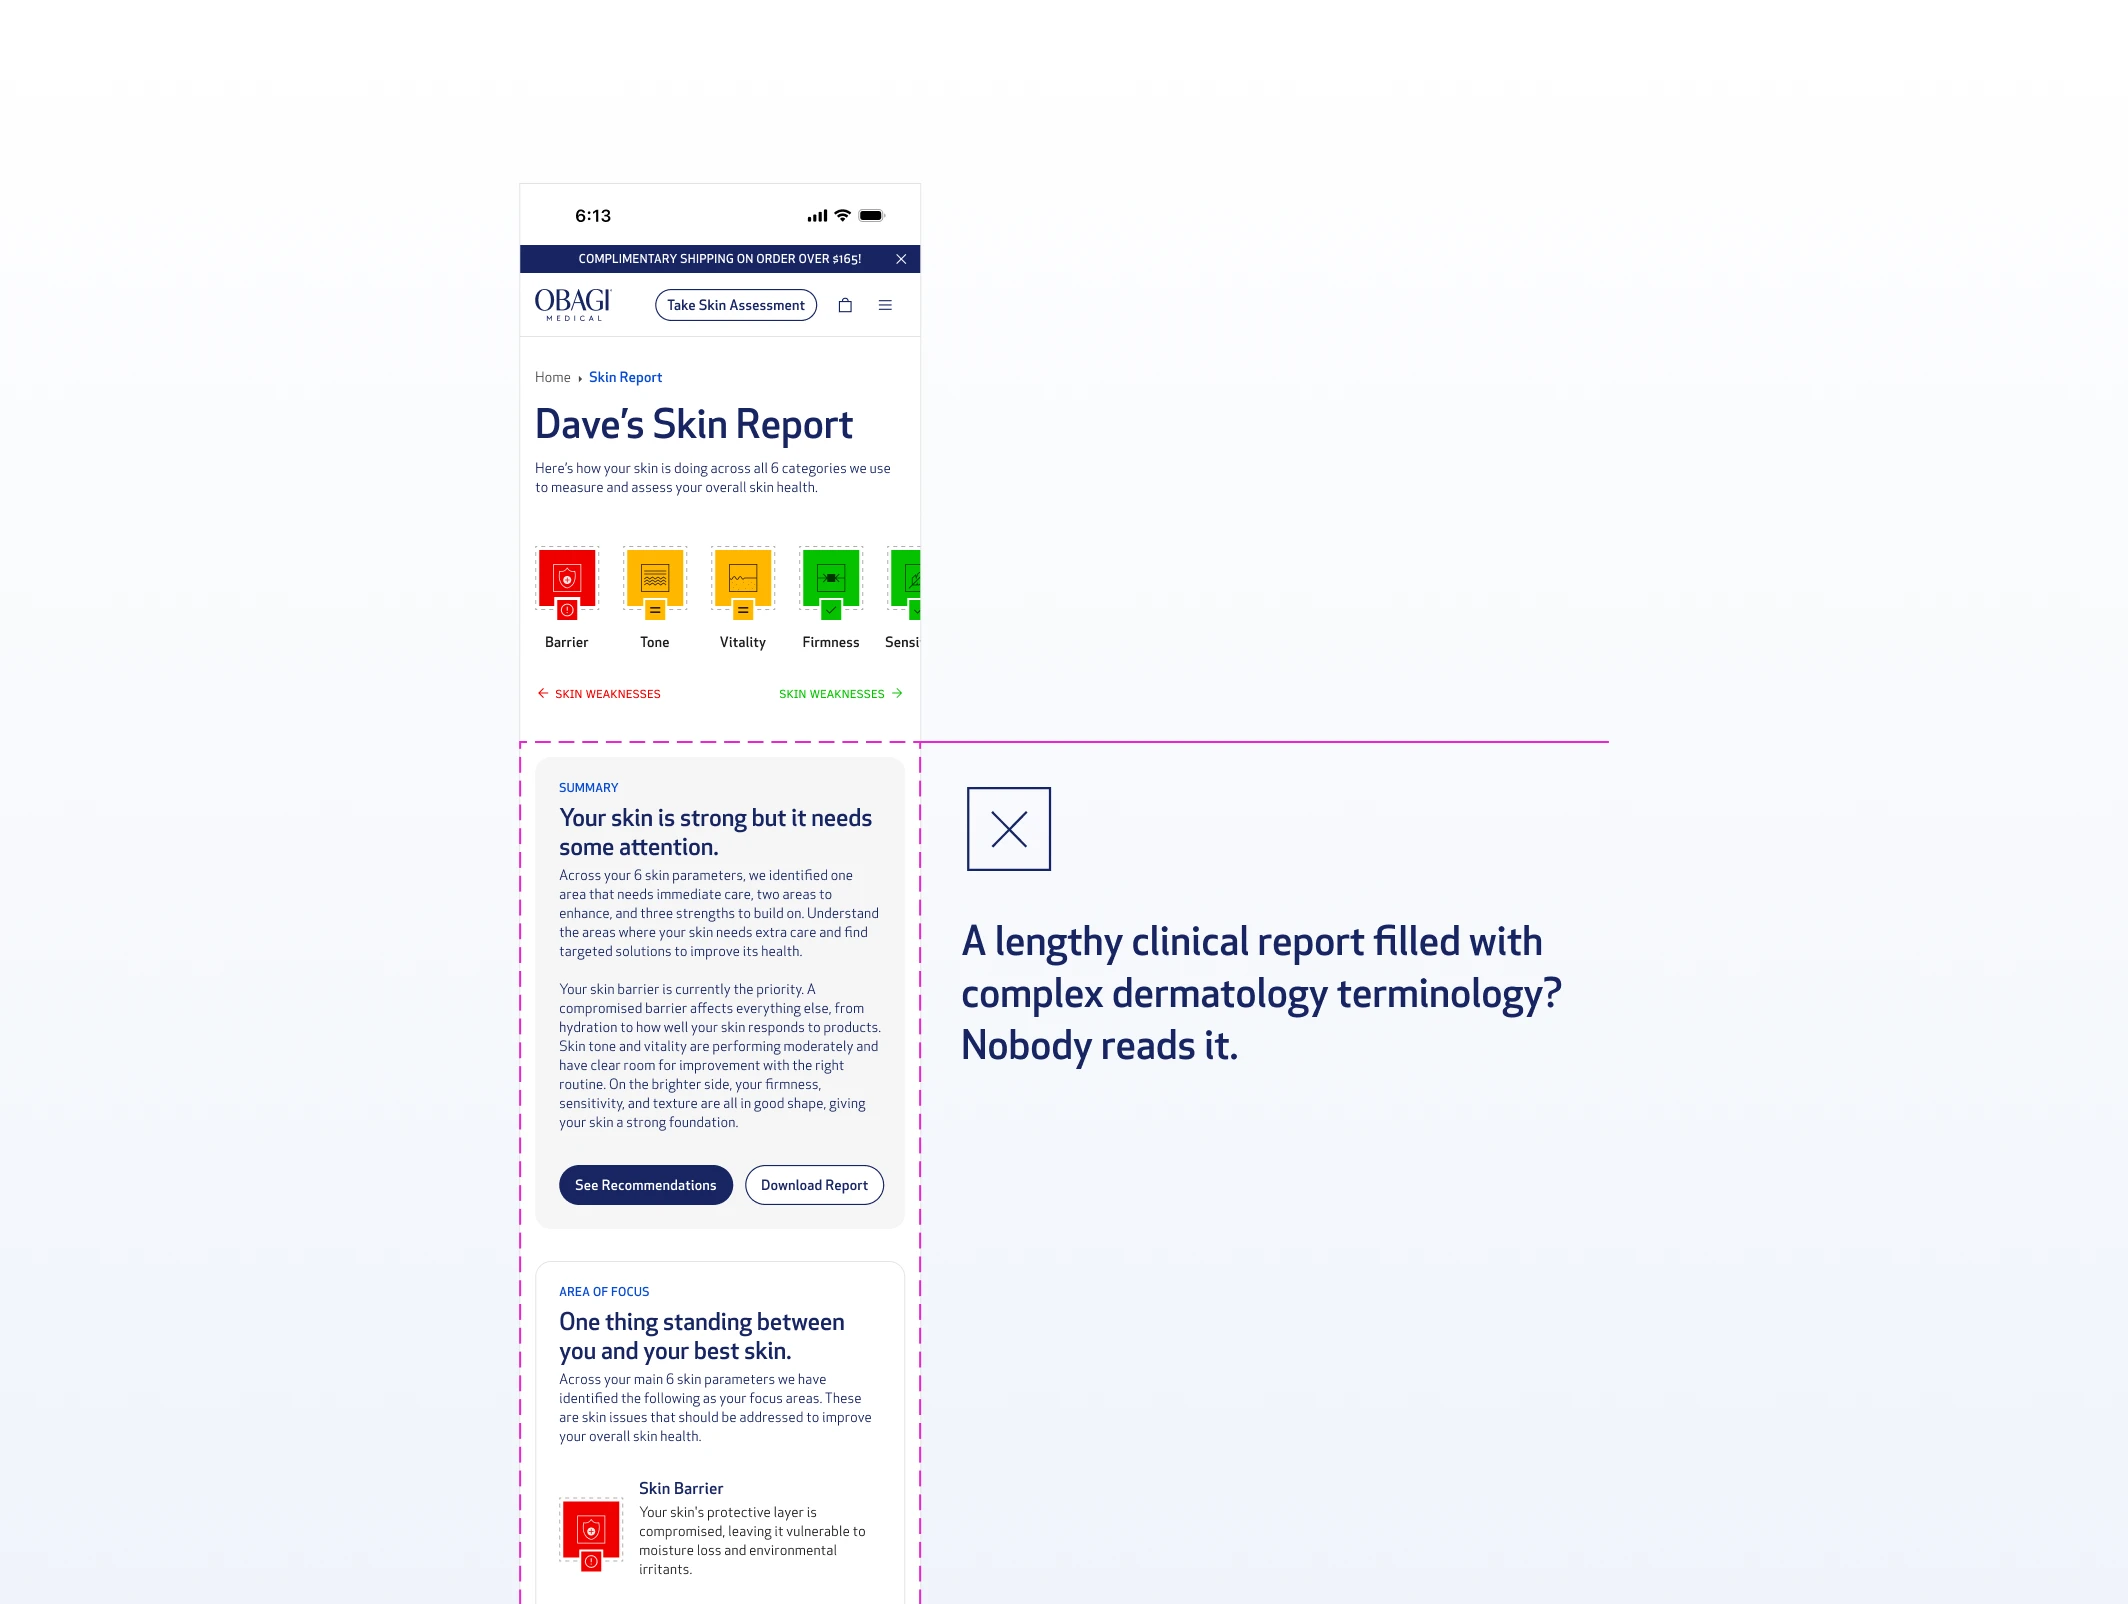
But skin ontology is foreign to most people. Terms like "skin barrier," "transepidermal water loss," or "melanin irregularity" mean nothing without context. And even when explained, a long page of findings creates a new problem: nobody reads it.
Obagi case study, image 11
Obagi case study, image 12

Nobody reads a lengthy clinical report.

If users don't understand their report, they won't trust the recommendation. If they don't trust the recommendation, they won't buy. The report isn't just a UX problem, it's a conversion problem too.
Obagi case study, image 13
Obagi case study, image 14

Competitors' Skin Scan Report

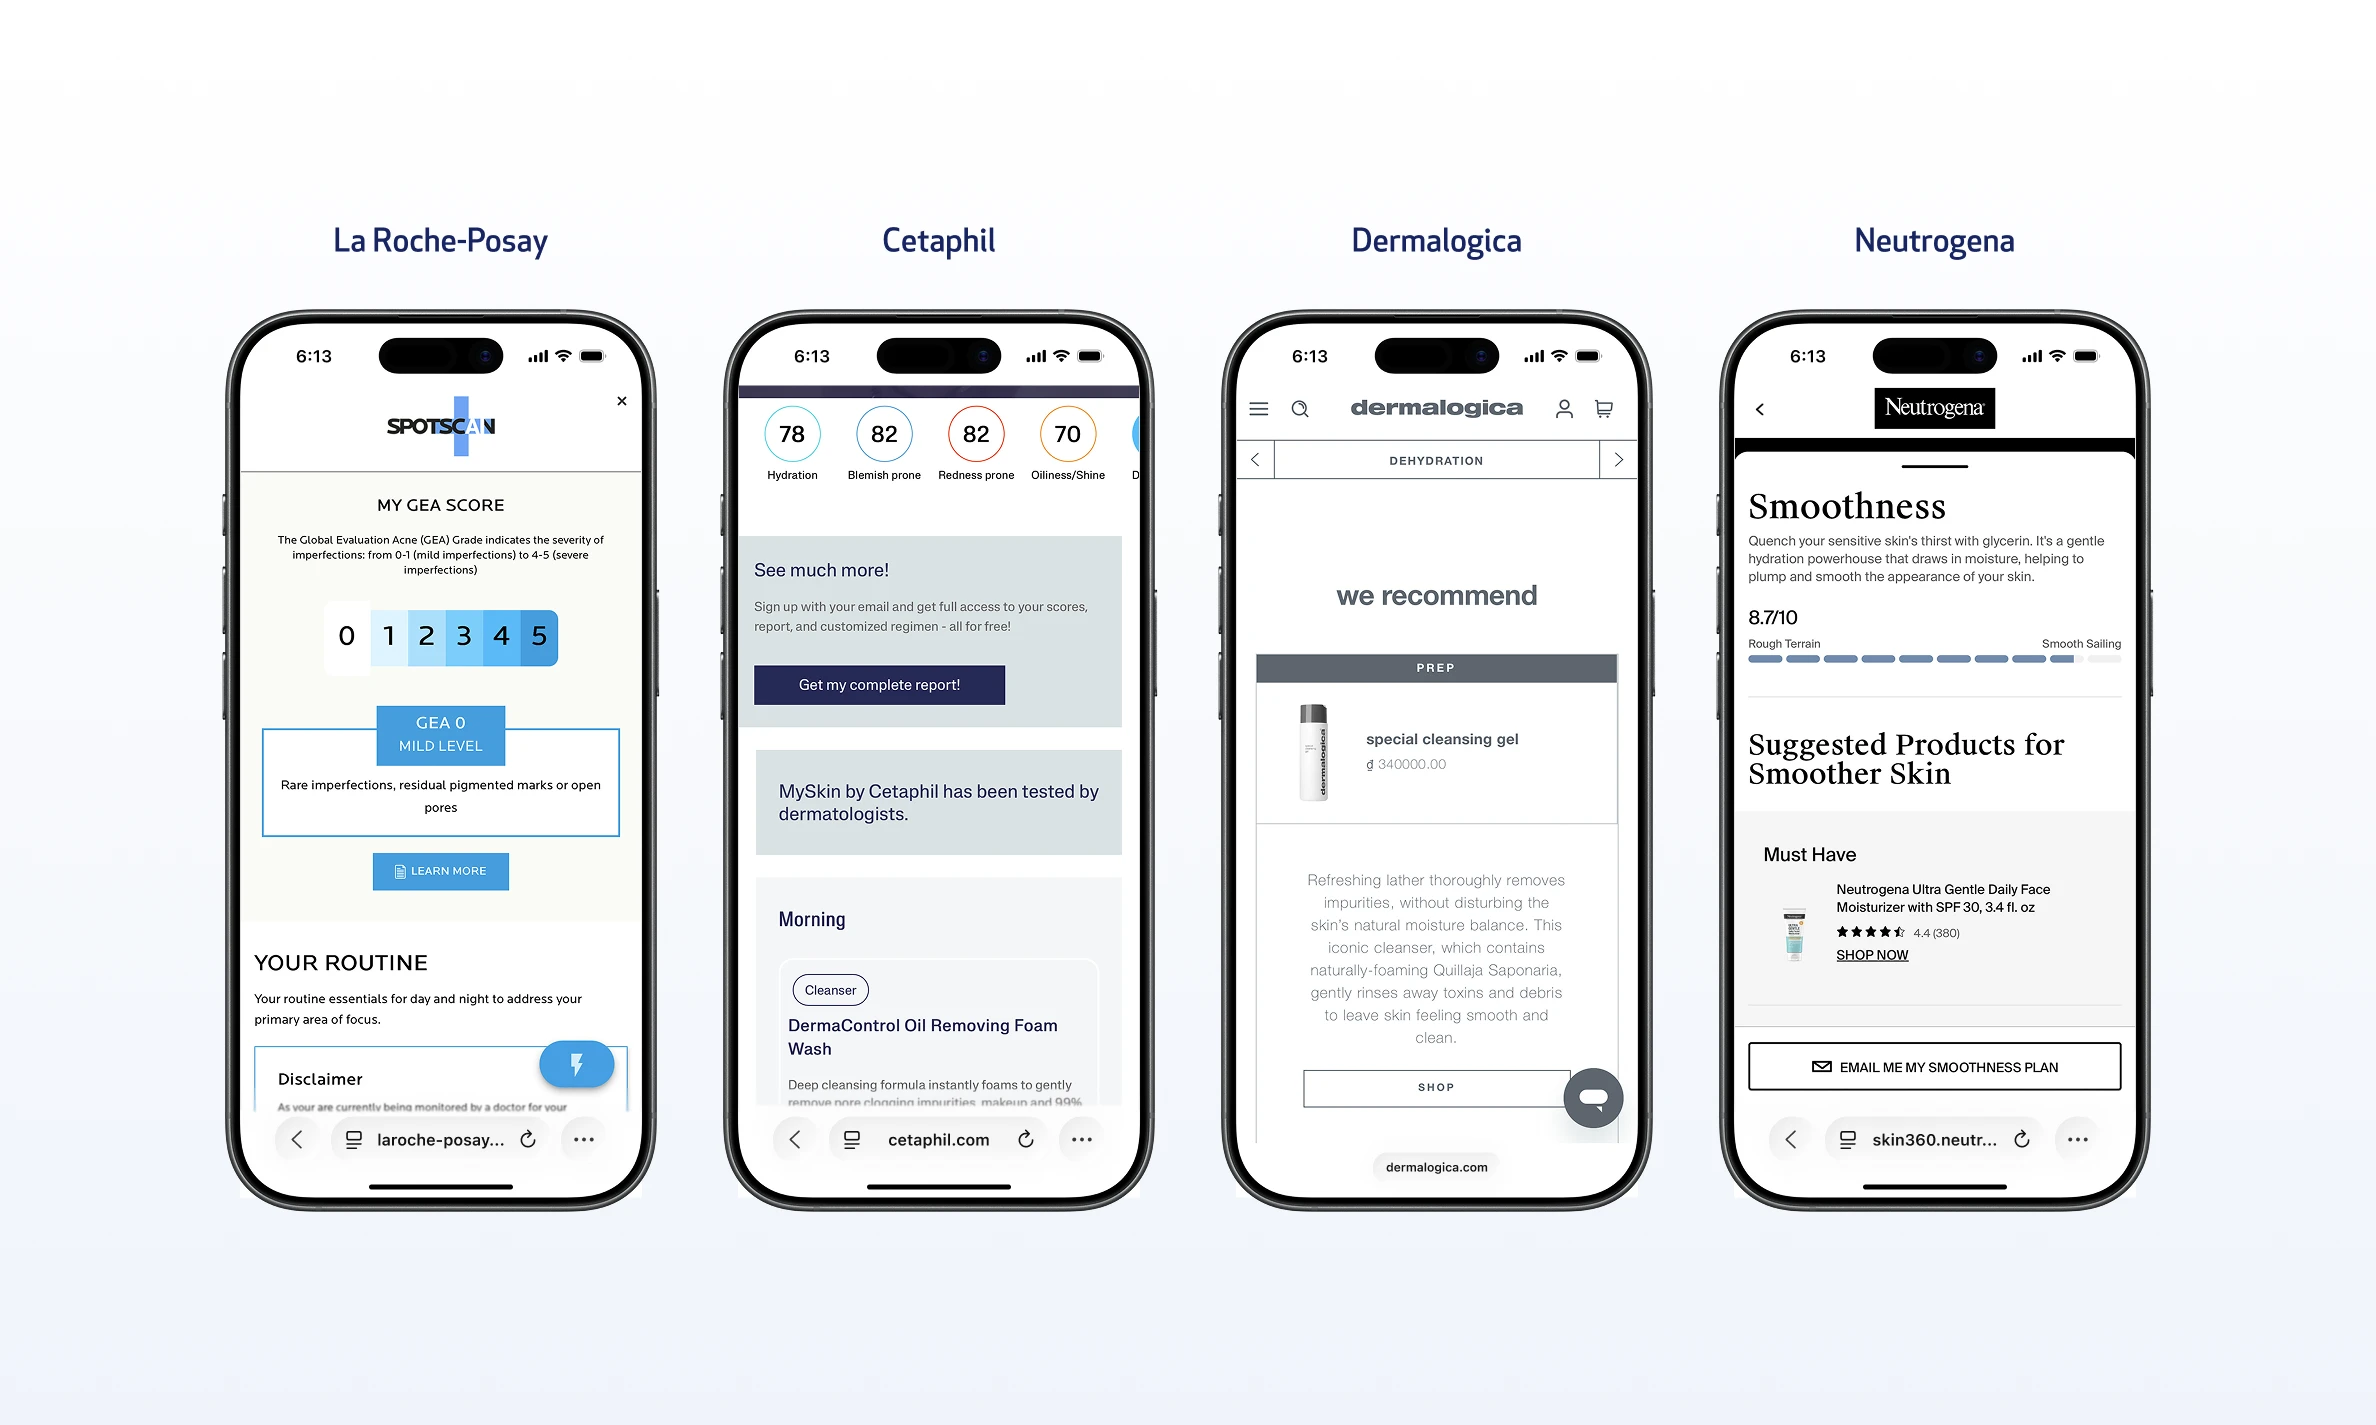
Every major skincare brand with a scan or assessment feature had the same format: a vertical scroll page, clinical findings up top, products below the fold. Long, dense, and structured like a medical document.

The question wasn't how to make that format better. It was whether that format was the right answer at all.

How might we

How might we preserve Obagi's clinical authority while making the skin report engaging enough to drive conversion?

PROCESS

The first two versions got the layout right and the format wrong.

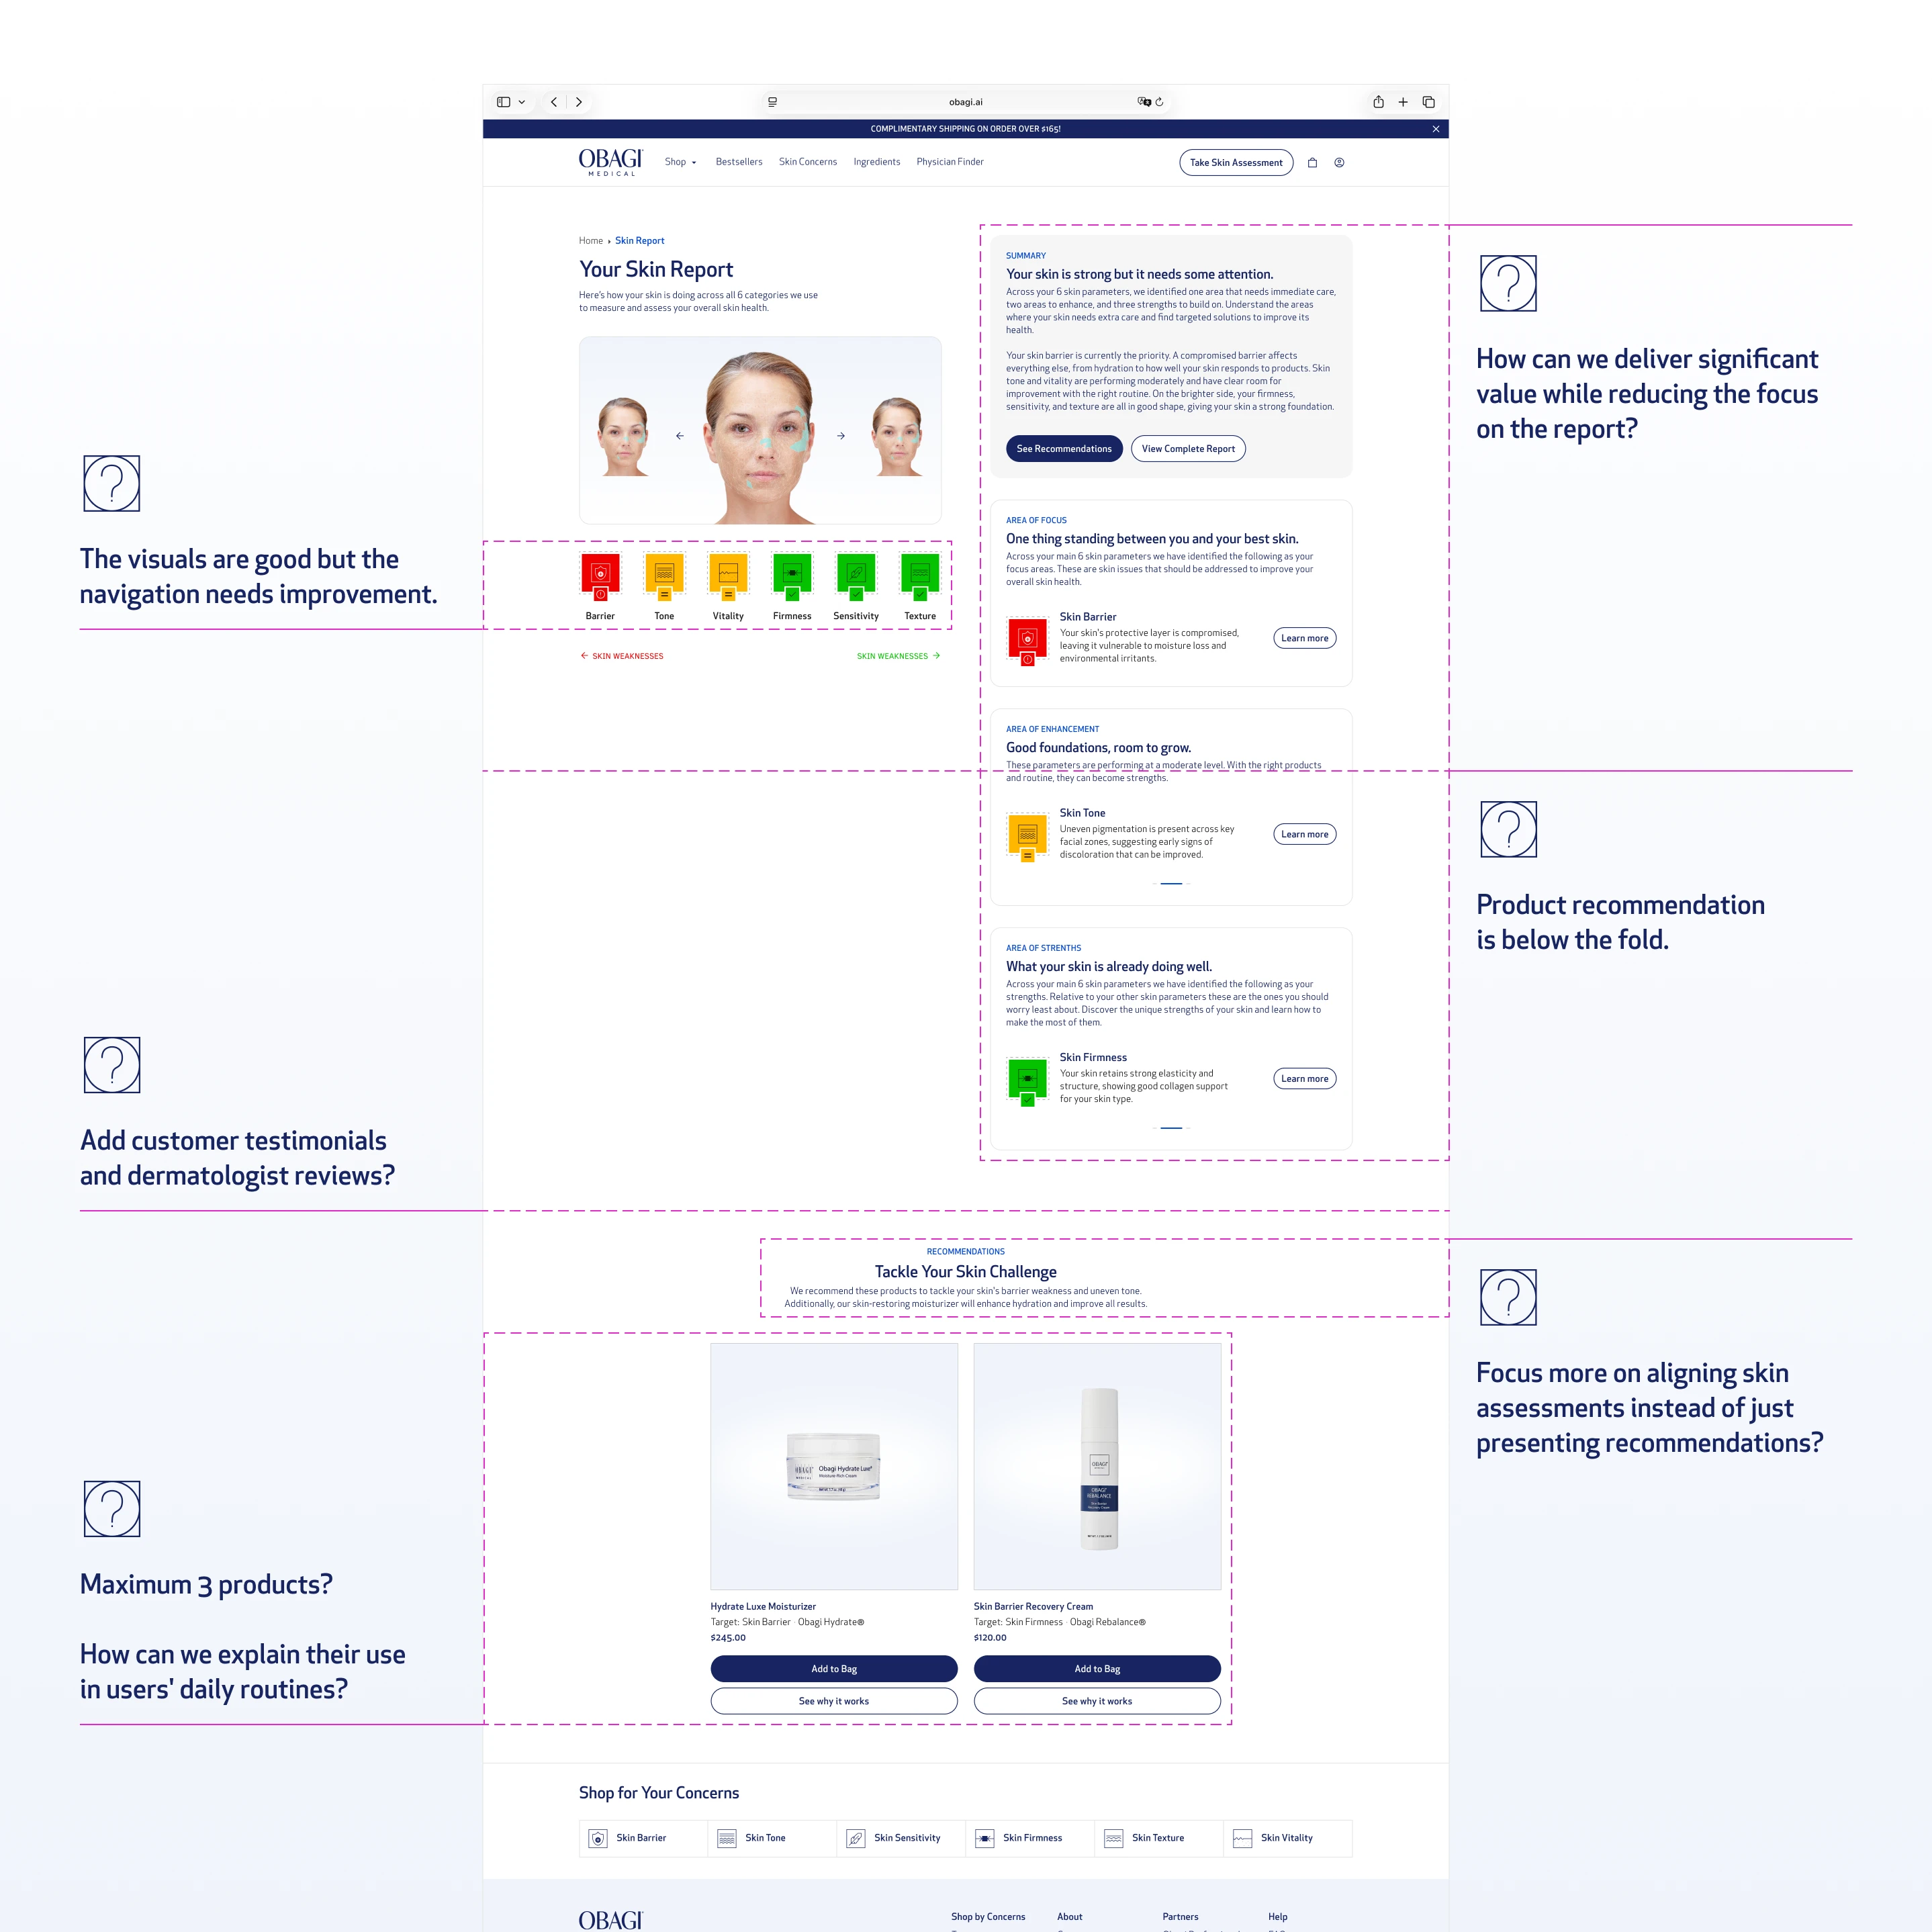
The first version followed the standard pattern. A vertical scroll page with scan results at the hero, skin parameter scores (barrier, firmness, skin tone, texture), strength and focus area breakdowns, and product recommendations below. Clean layout, simple UI, nothing wrong with it technically.
Obagi case study, image 15
Obagi case study, image 16

Vertical Layout: Desktop Iteration

The internal reaction from the Obagi team was calm. When discussing opportunities to enhance the experience, the team had a productive discussion around layout enhancements and how to provide more value without overloading the report.
Obagi case study, image 17
Obagi case study, image 18

Vertical Layout: Desktop Iteration

I was already diagnosing the problem while building the wrong solution.

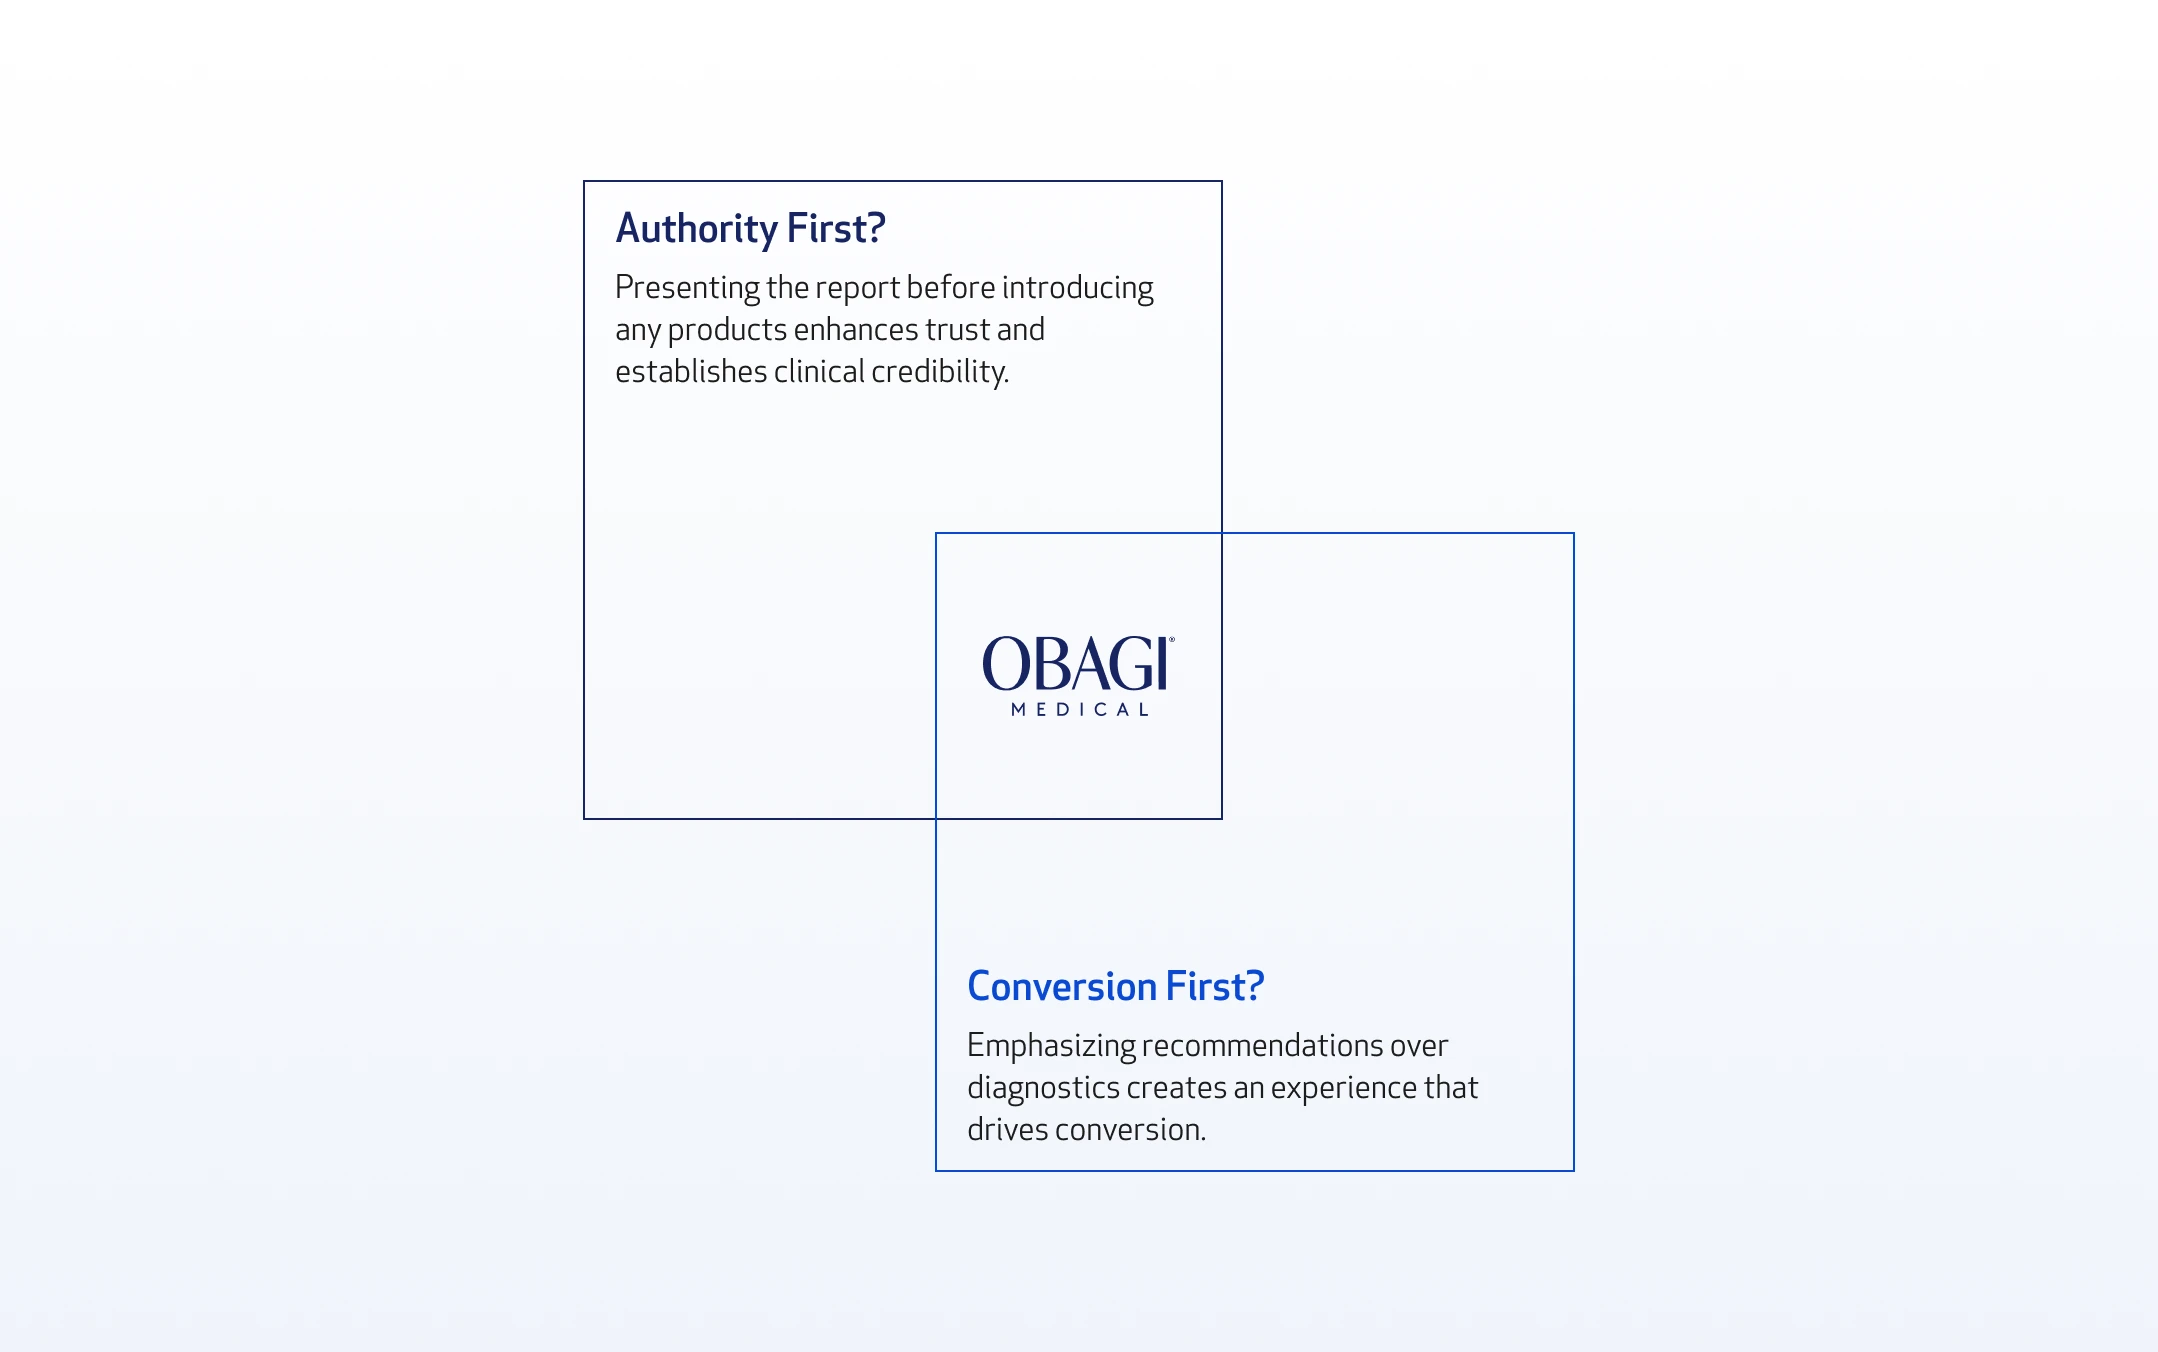
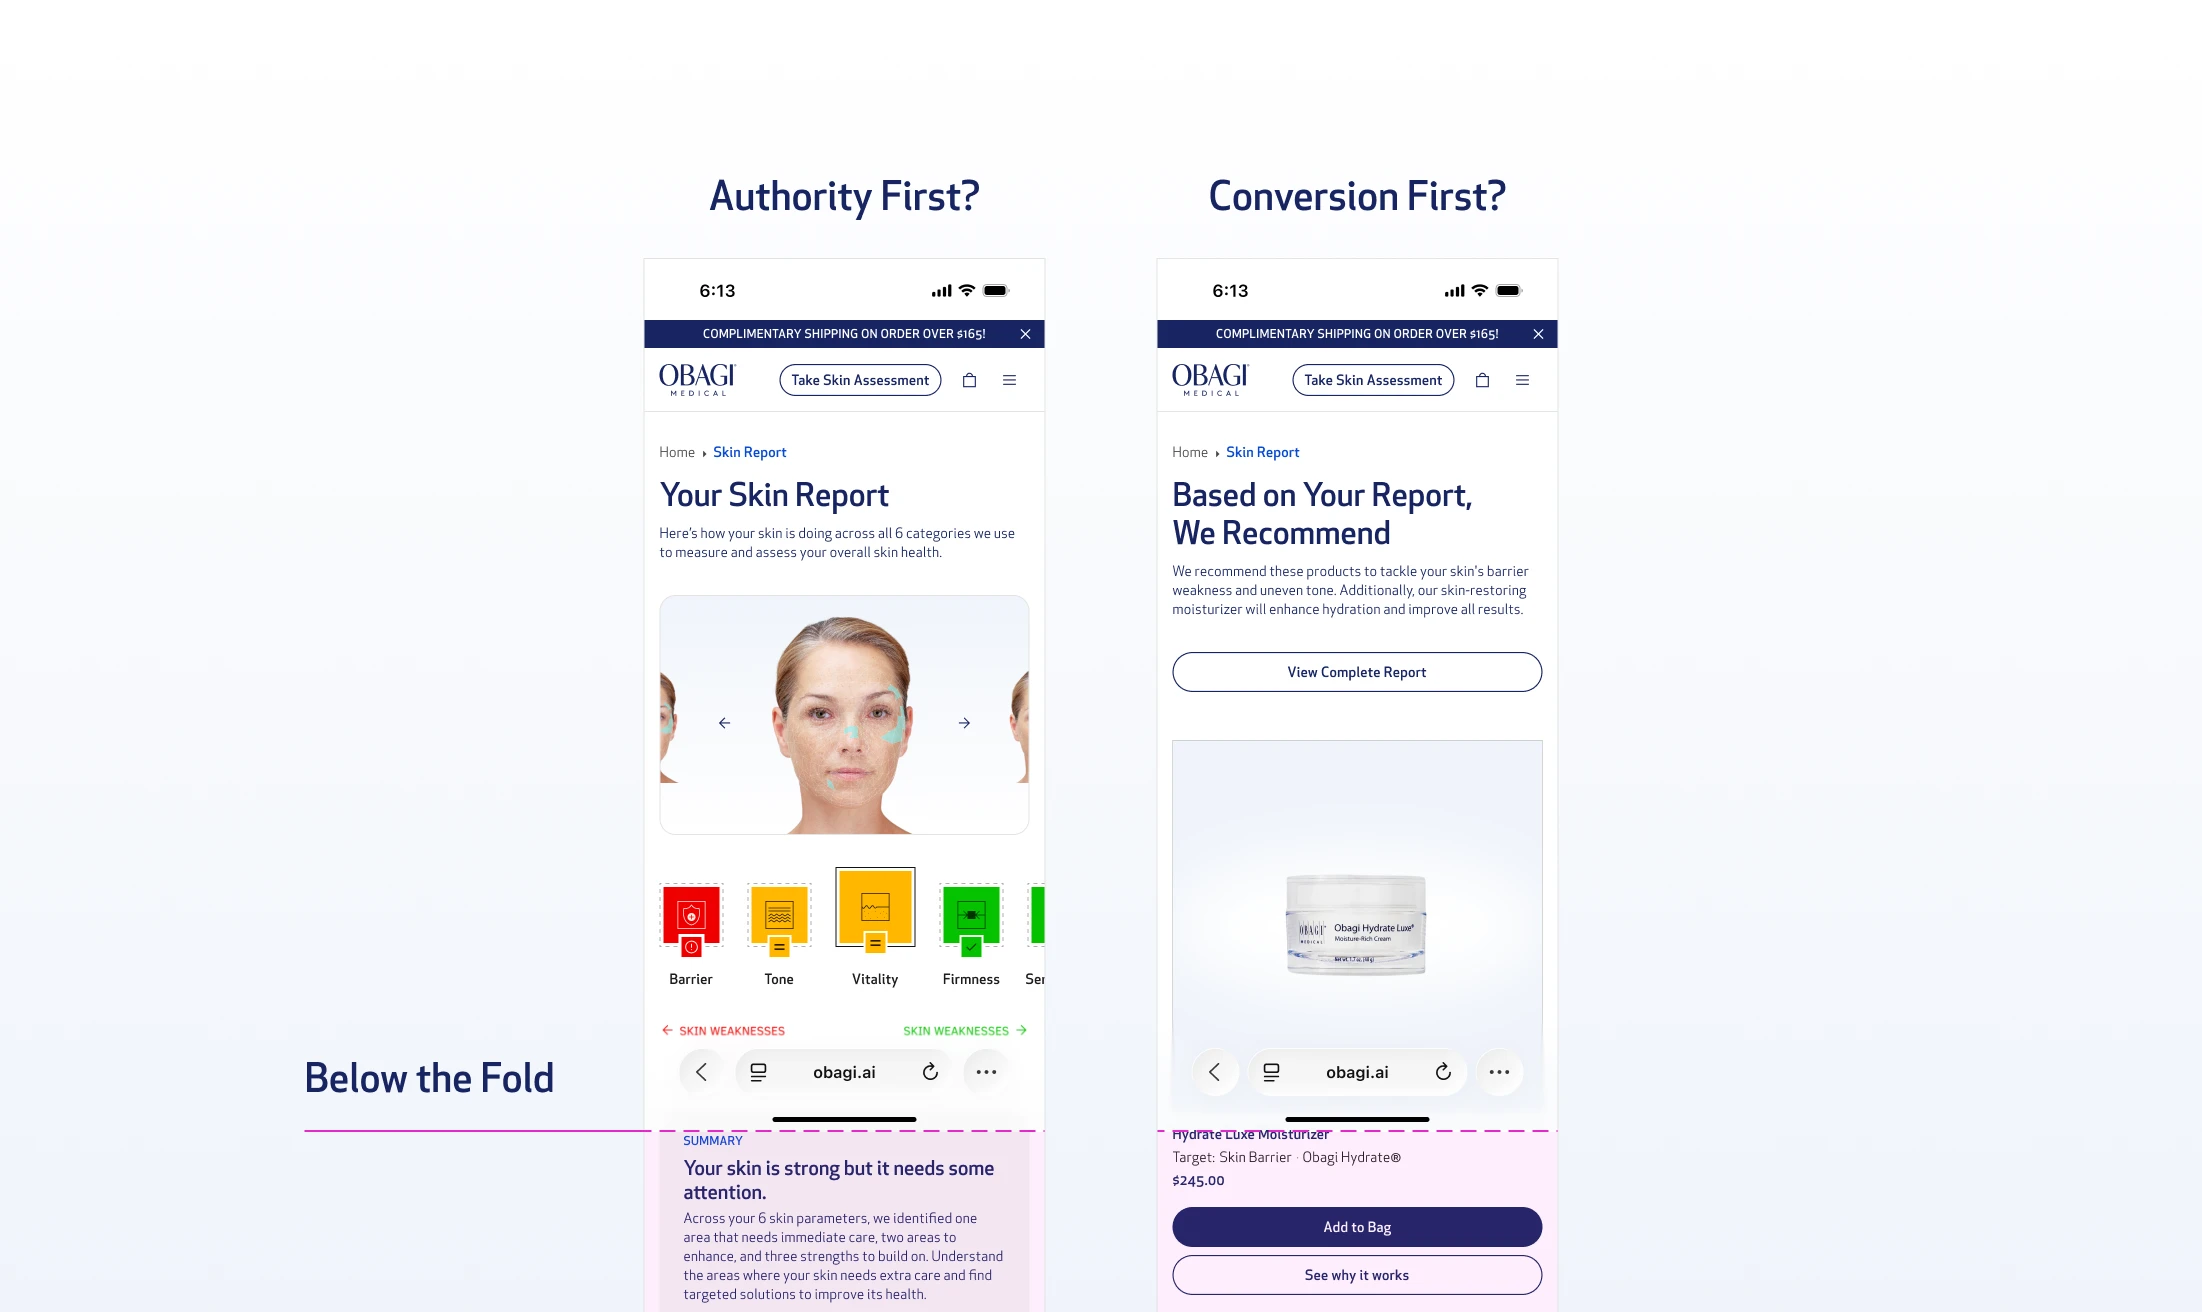
The core tension that emerged in review: Obagi is a clinical brand. They needed the report to establish authority. To signal that you're not just being sold a product, you're receiving a professional-grade diagnosis. But that same clinical weight was pushing the product recommendation below the fold, burying the most important conversion moment under a wall of findings the user didn't ask for and wouldn't read.
Obagi case study, image 19
Obagi case study, image 20

Vertical Layout: Mobile Iteration

Moving the report down felt like compromising the brand. Keeping it up front hurt the conversion. We iterated through a second version adding more social proof layers - dermatologist quotes, before-and-after sections, testimonials. The page got longer. The tension got worse, especially on mobile

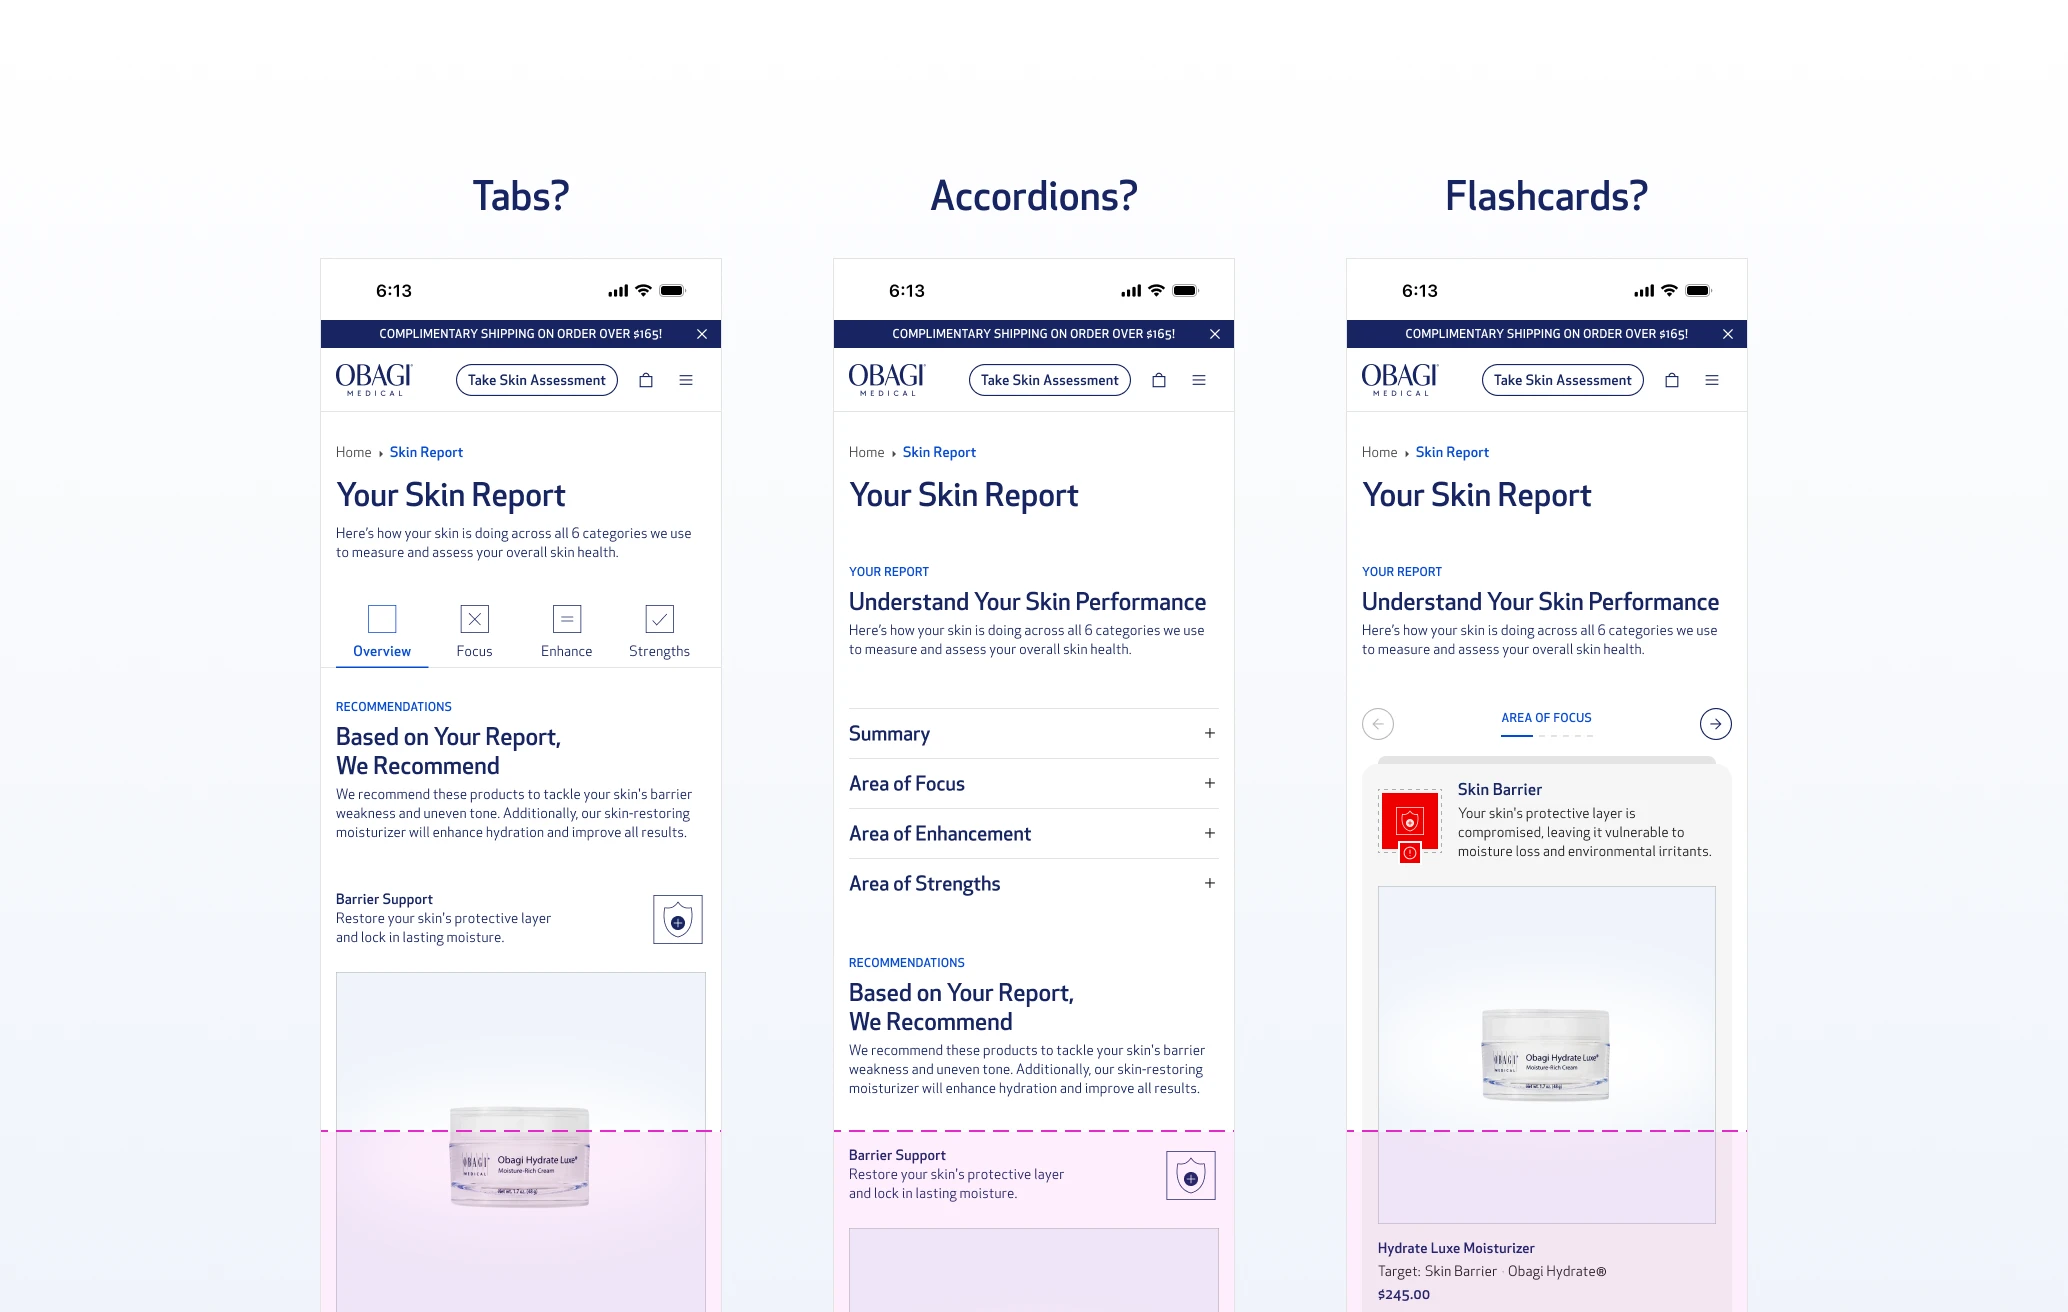
Before committing to any solution, I explored three structural directions:

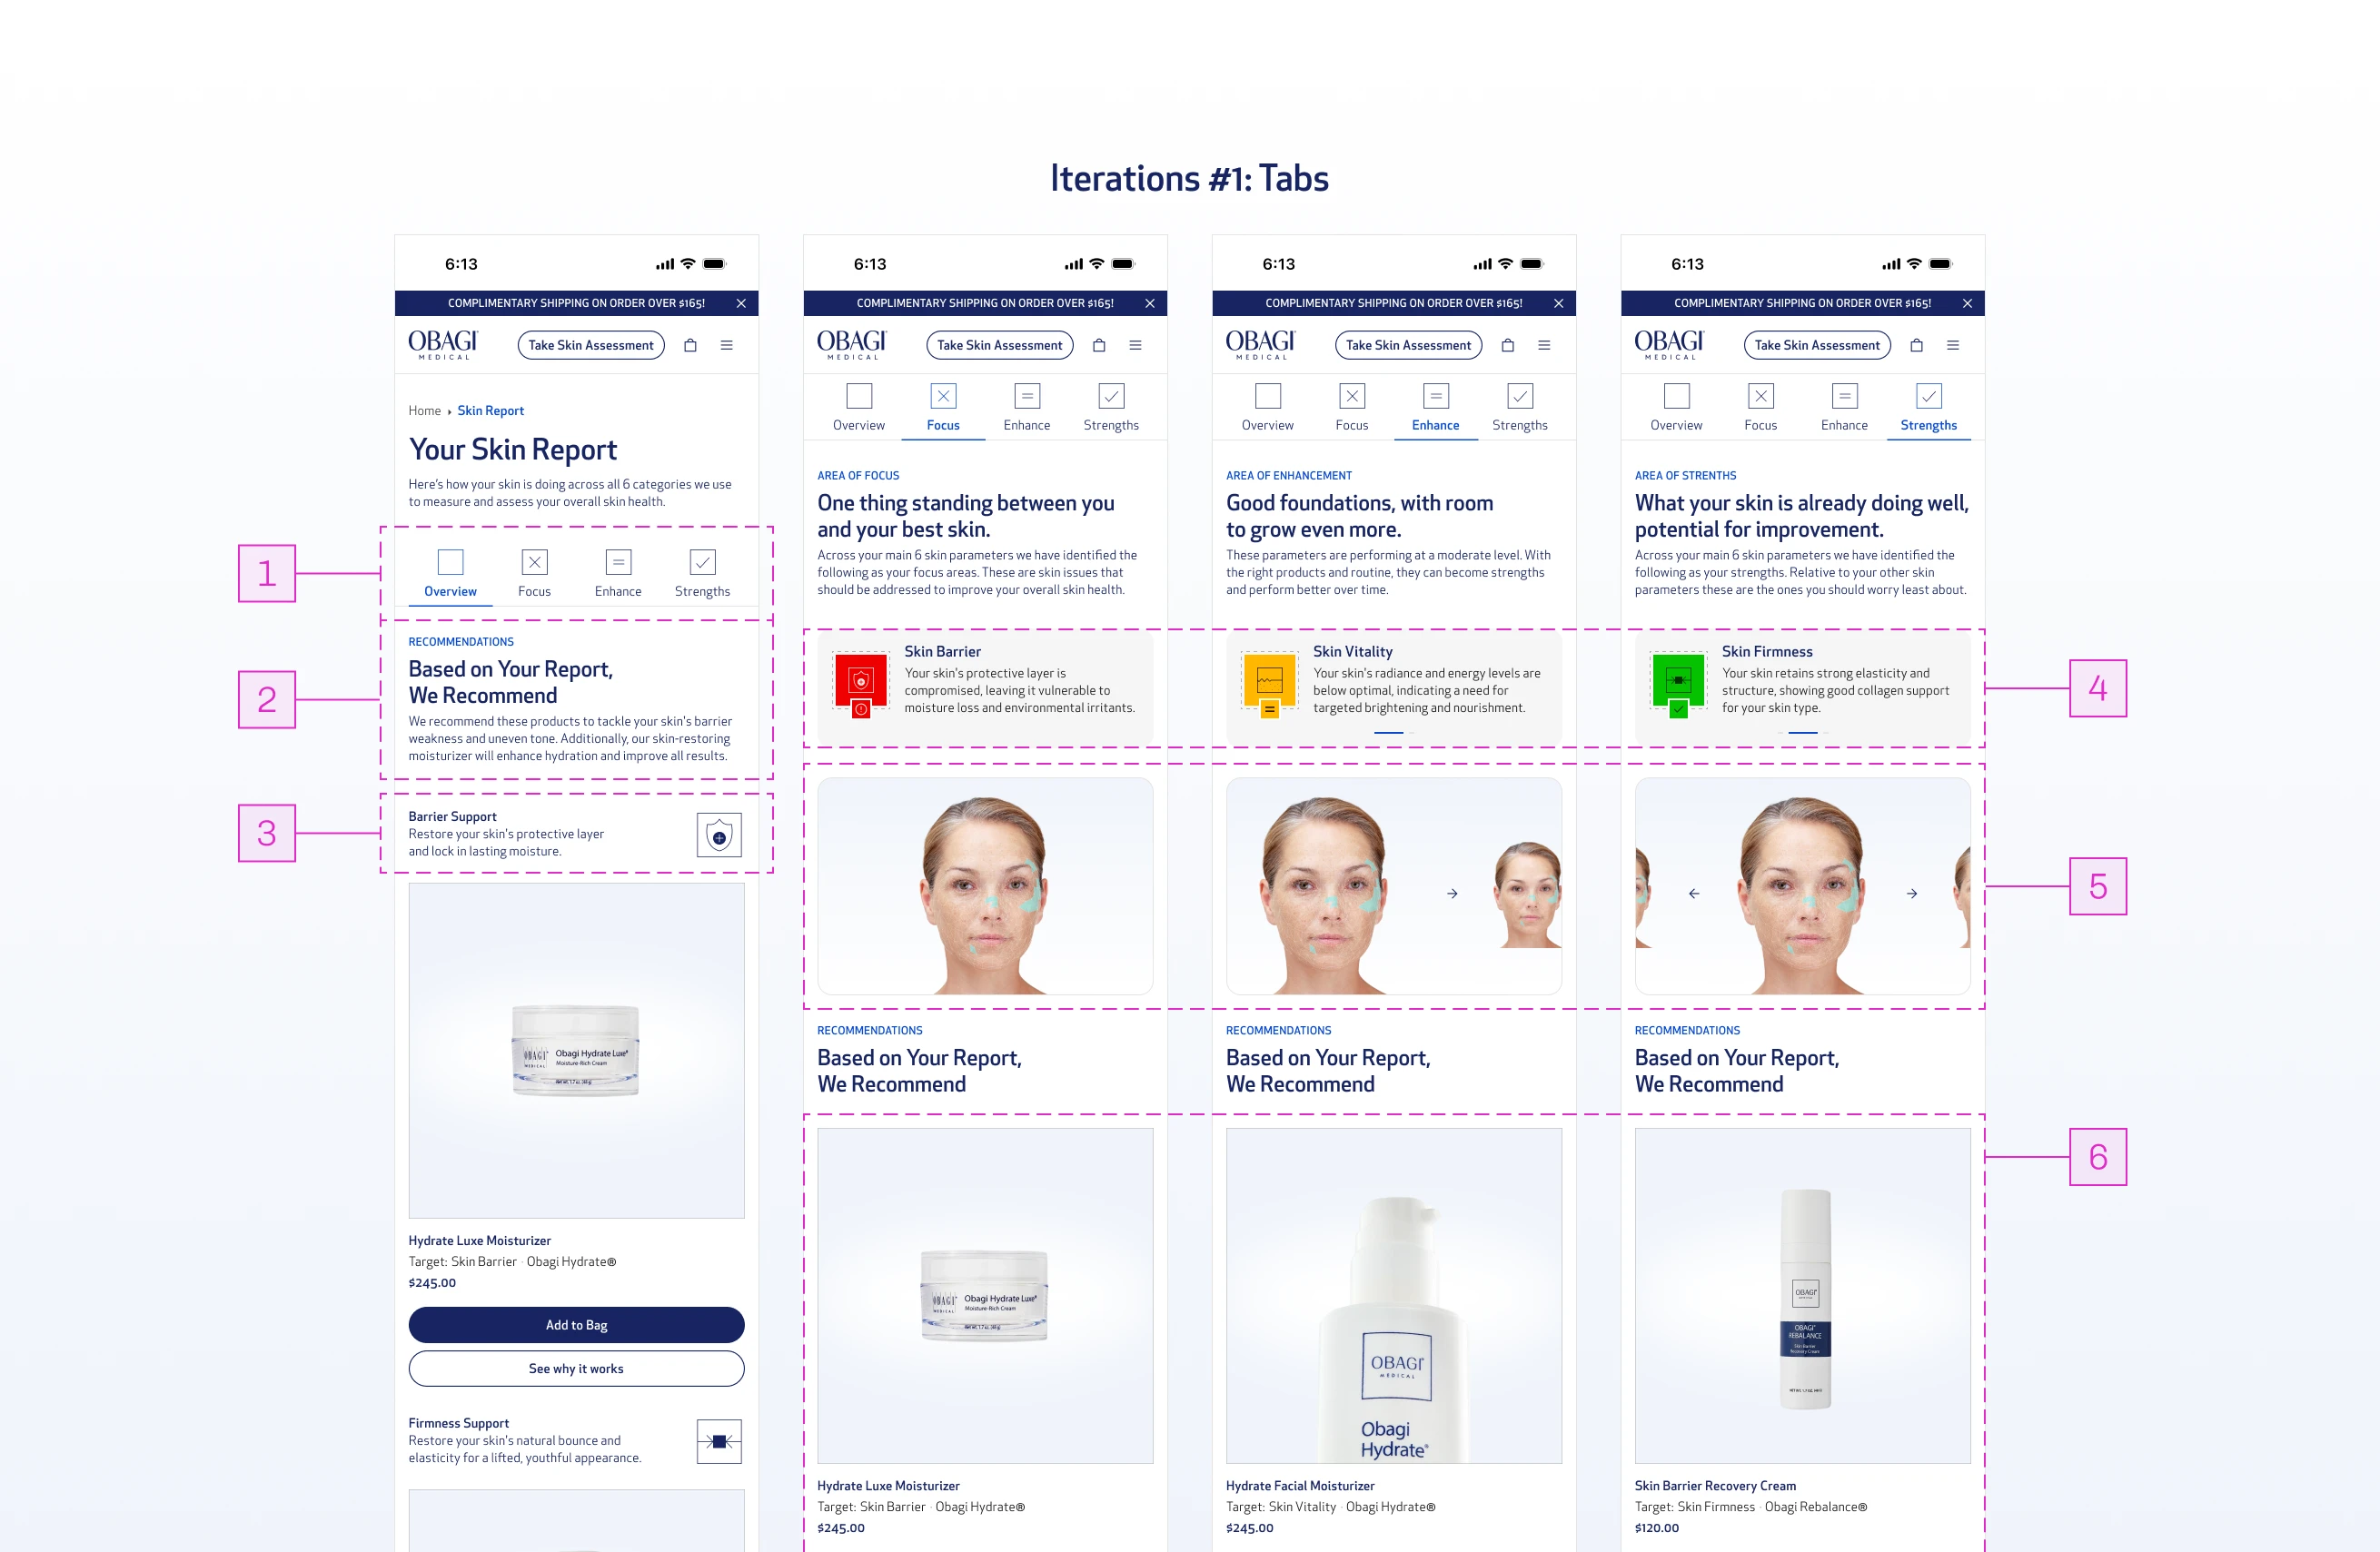
Tabs

A progressive disclosure pattern that saves space and lets users jump directly to what they care about. If a user only wants the recommendation, they can scroll straight down without reading through the report.
Obagi case study, image 21
Obagi case study, image 22

Iteration #1: Tabs

01

Tabs act as a progressive disclosure pattern, hiding the detailed report by default.

02

With the report hidden, the recommendation section sits above the fold: prioritizing conversion.

03

Recommendations in the Overview tab are mapped to each skin parameter, directly communicating which products target which problems.

04

Each tab represents a scan area, with swipeable parameters to explore individual findings.

05

Each parameter includes annotated scan imagery to visually communicate exactly where the scan was read.

06

Product recommendations remain visible within each tab, narrowed to the concerns specific to that area, keeping conversion prioritized.

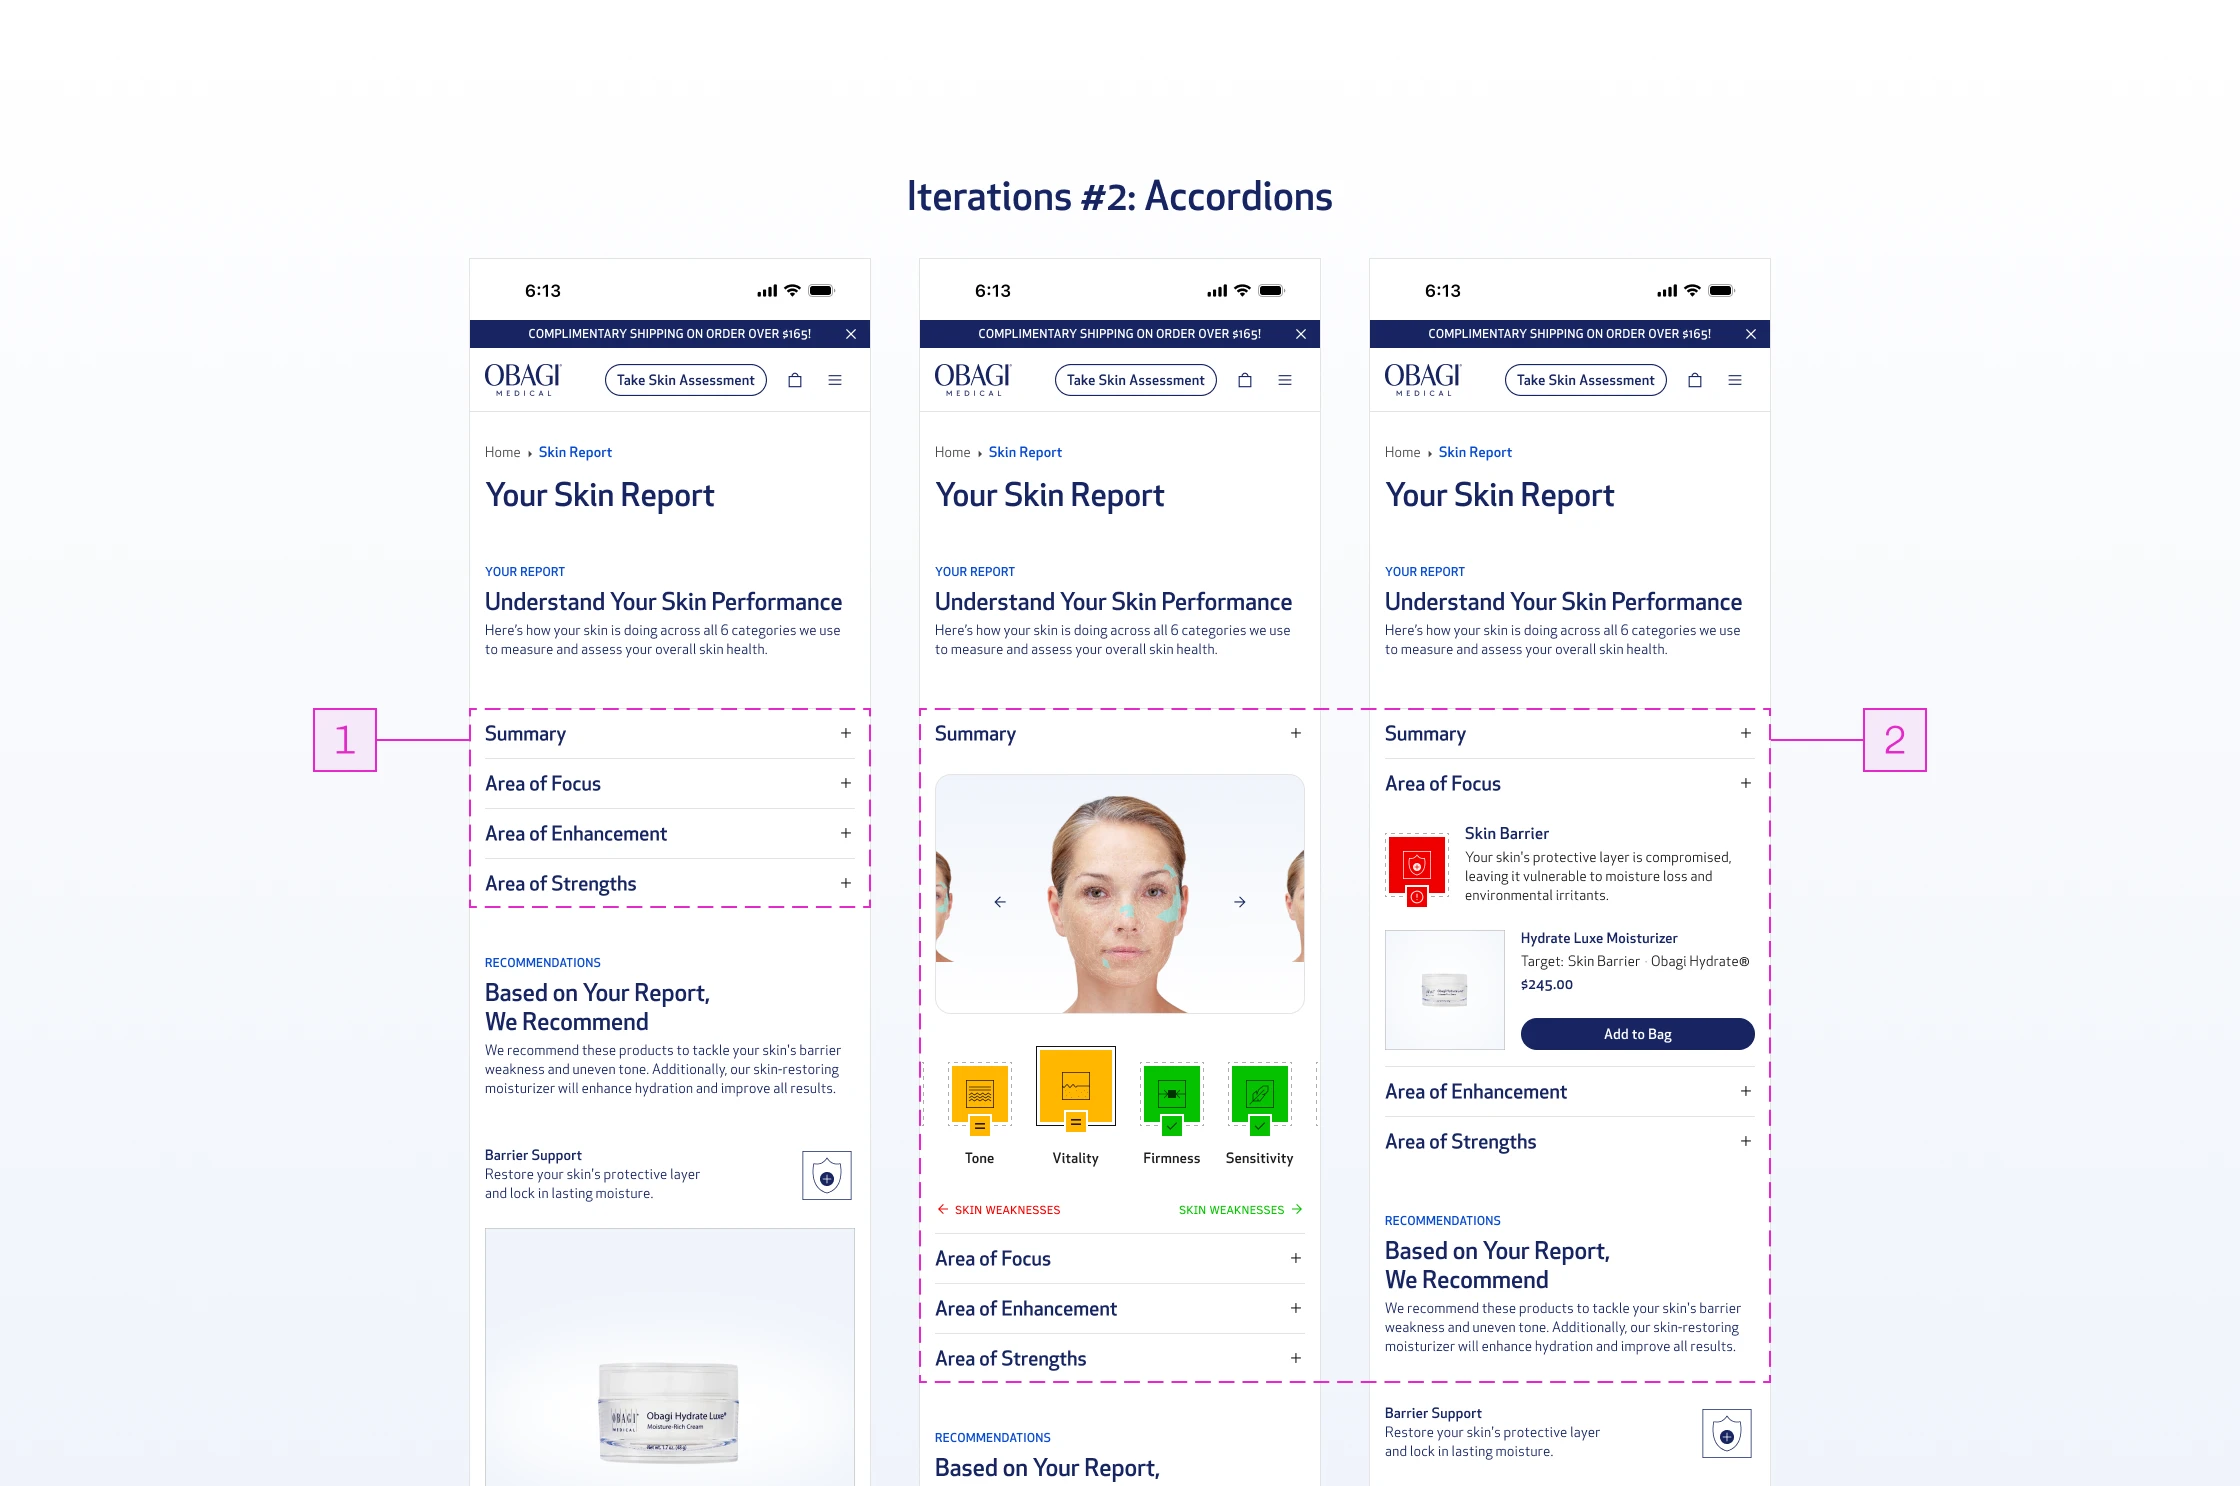
Accordions

The same progressive disclosure logic as tabs, but within a scrolling behavior. Users stay in a familiar vertical flow while controlling how much detail they expose.
Obagi case study, image 23
Obagi case study, image 24

Iteration #2: Accordions

01

Accordions collapse the report into expandable rows, pushing recommendations higher without removing the report entirely.

02

Users can expand each row to read the findings, but the pattern works against the experience here. Accordions are designed to hide secondary or familiar content, not critical new information. For a first-time user encountering their report, hiding findings behind a click introduces friction where there should be clarity.

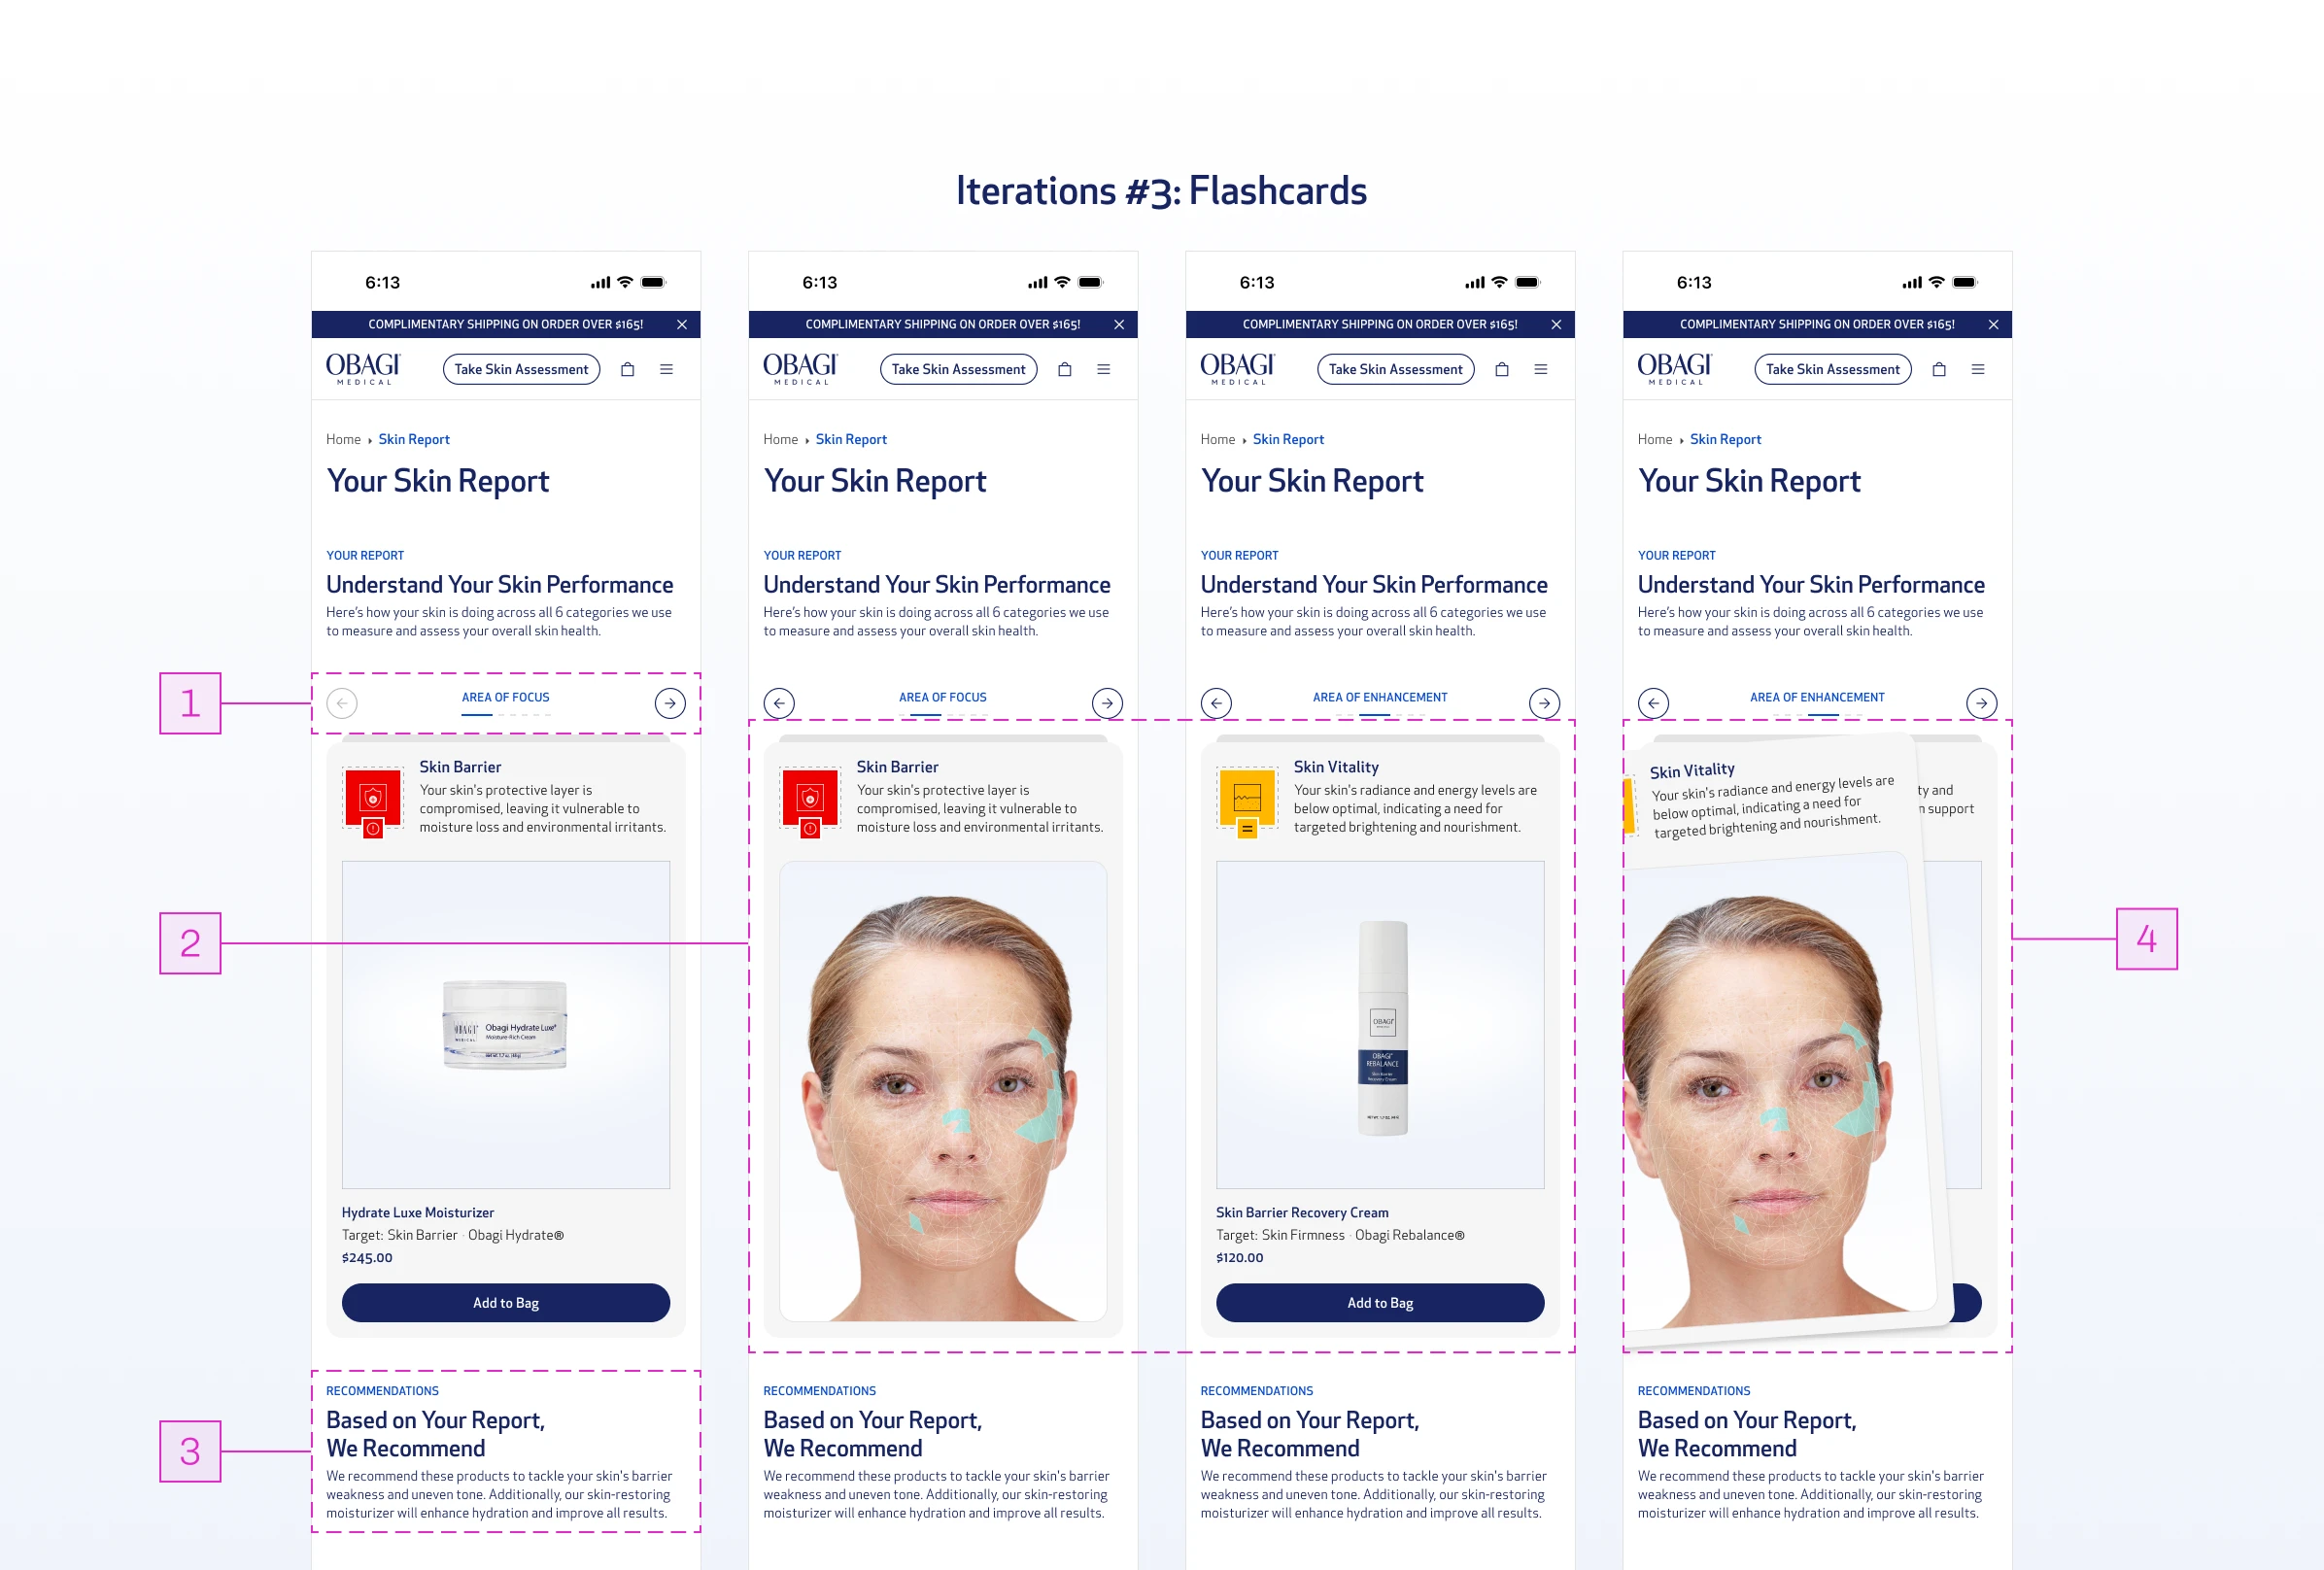
Flashcards

A more engaging and interactive way to reveal information sequentially, while still following the same underlying structure of reporting findings, explaining concerns, and recommending products.
Obagi case study, image 25
Obagi case study, image 26

Iteration #3: Flashcards

01

Swipe-based navigation guides users through the report sequentially, removing decision fatigue. Unlike tabs and accordions, the content reveals itself one step at a time so the user just swipes.

02

Product recommendations are followed by supporting imagery, adding credibility and visual engagement to each finding.

03

Aggregated recommendations sit below the flashcard experience, maintaining conversion focus without interrupting the sequence.

04

The interaction itself carries the experience, making the report feel worth going through rather than worth skipping.
Obagi case study, image 27
Obagi case study, image 28

Iteration #1: Tabs

Tabs and Accordions reduced the visual density but introduced a different problem: they still required the user to decide what to read and when. The decision fatigue didn't go away, it just moved. Flashcards was closer, but it still put the user in control of pacing in a way that felt passive.

None of them resolved the real tension. They just rearranged it.

Insight

Scrolling through Apple Replay changed everything.

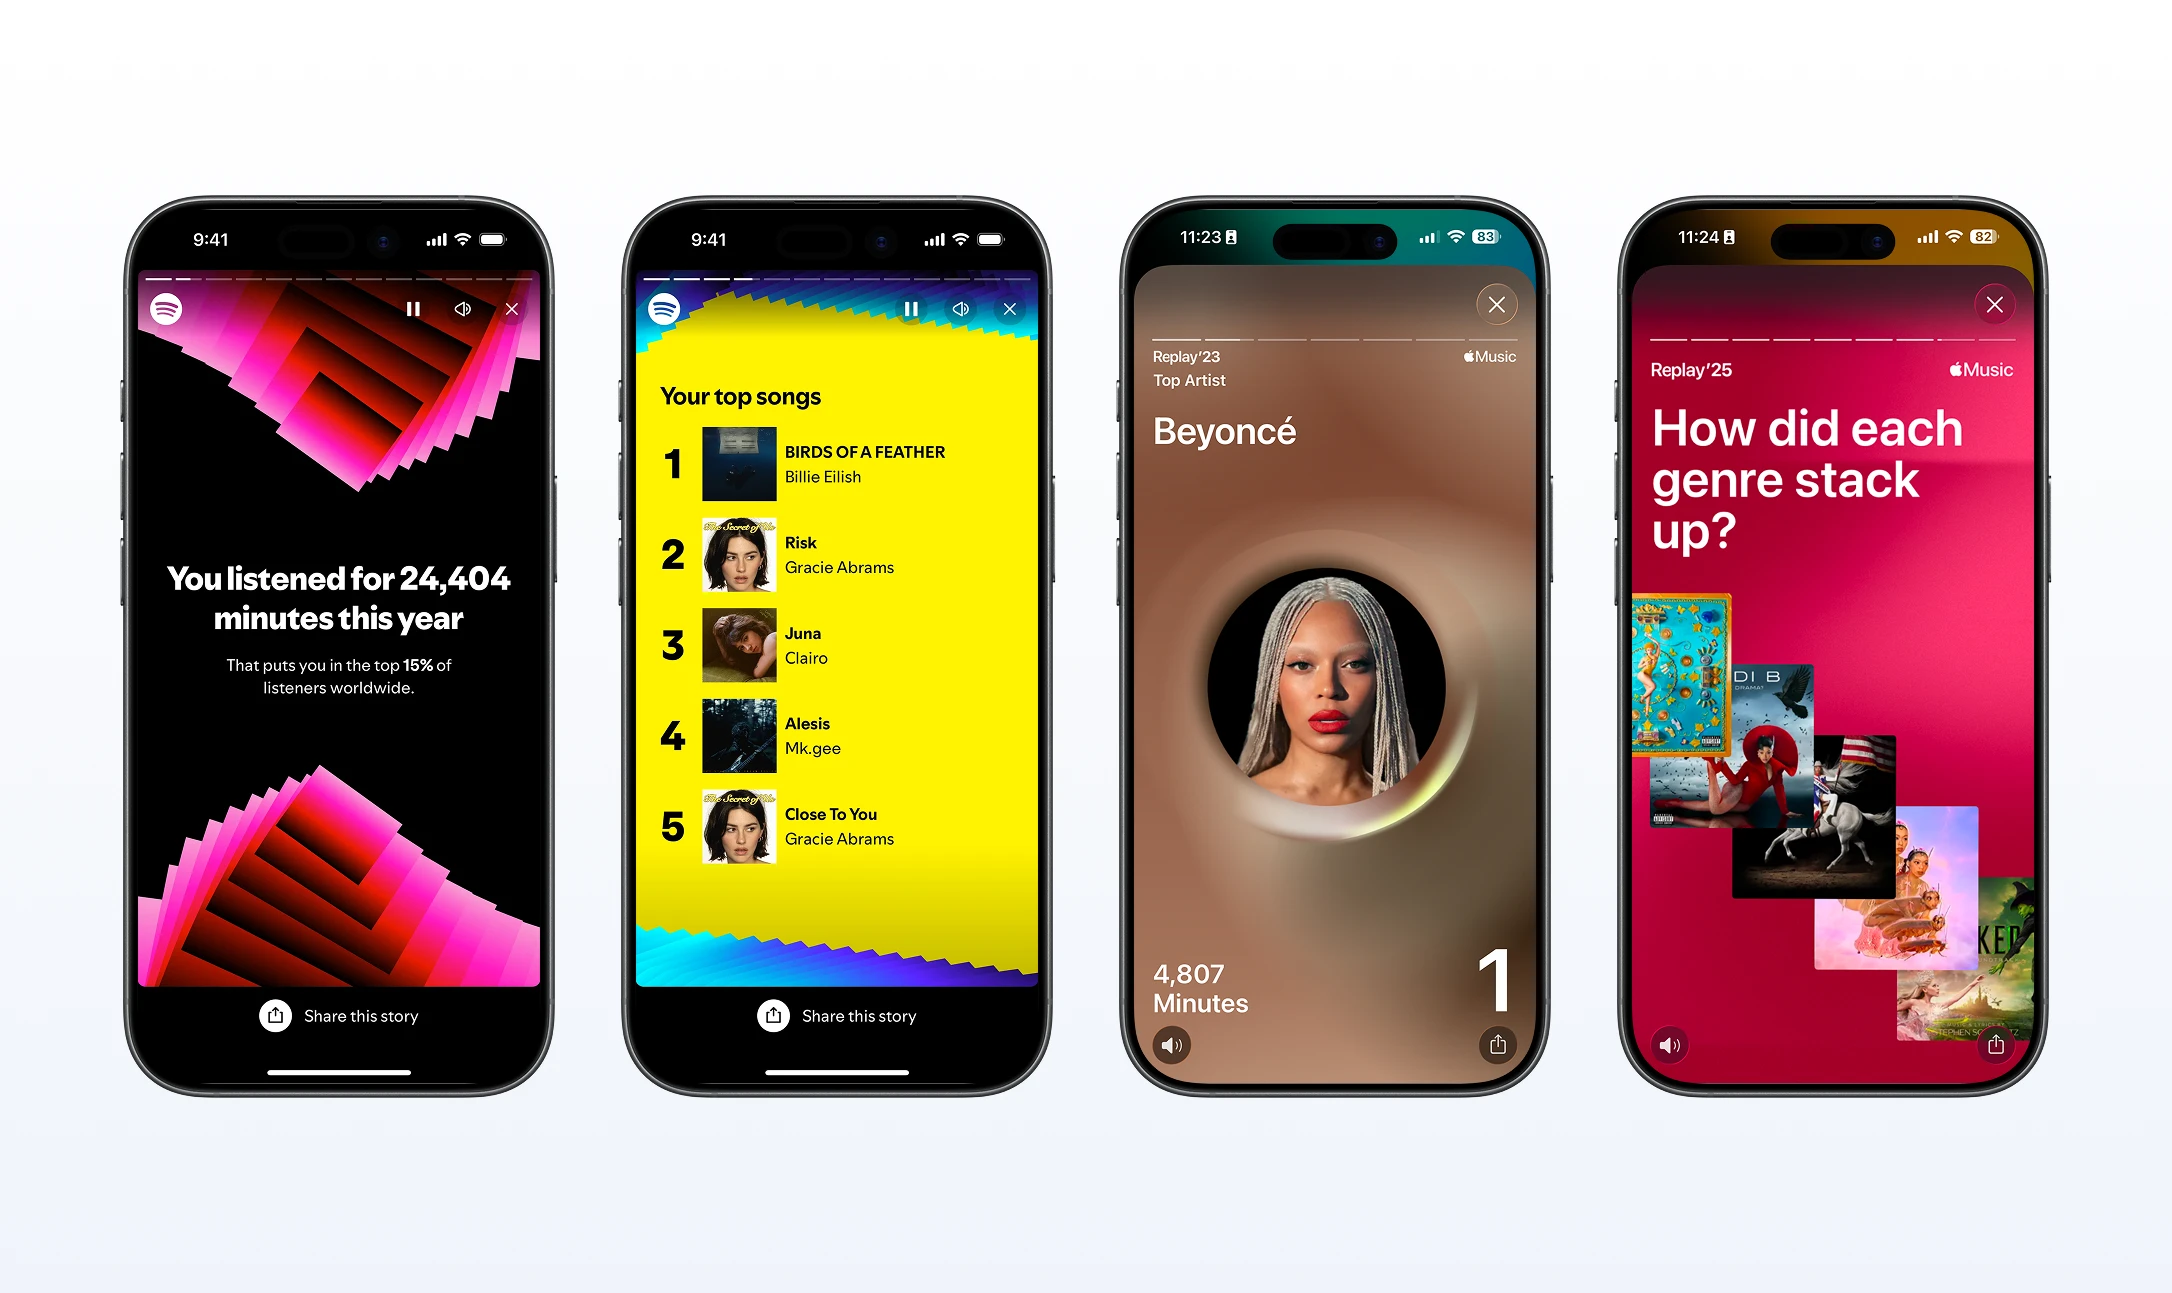
It was mid-year. I was scrolling through my Apple Replay monthly report when I remembered how Spotify Wrapped works.
Obagi case study, image 29
Obagi case study, image 30

Spotify Wrapped & Apple Replay

Wrapped takes data (your own listening habits) and delivers it back to you as a story, one moment at a time, in an order that builds to a payoff. You're not reading a report. You're being told something about yourself. It's full-screen, sequenced, and personal. Every frame has one job. Nothing competes.
Obagi case study, image 31
Obagi case study, image 32

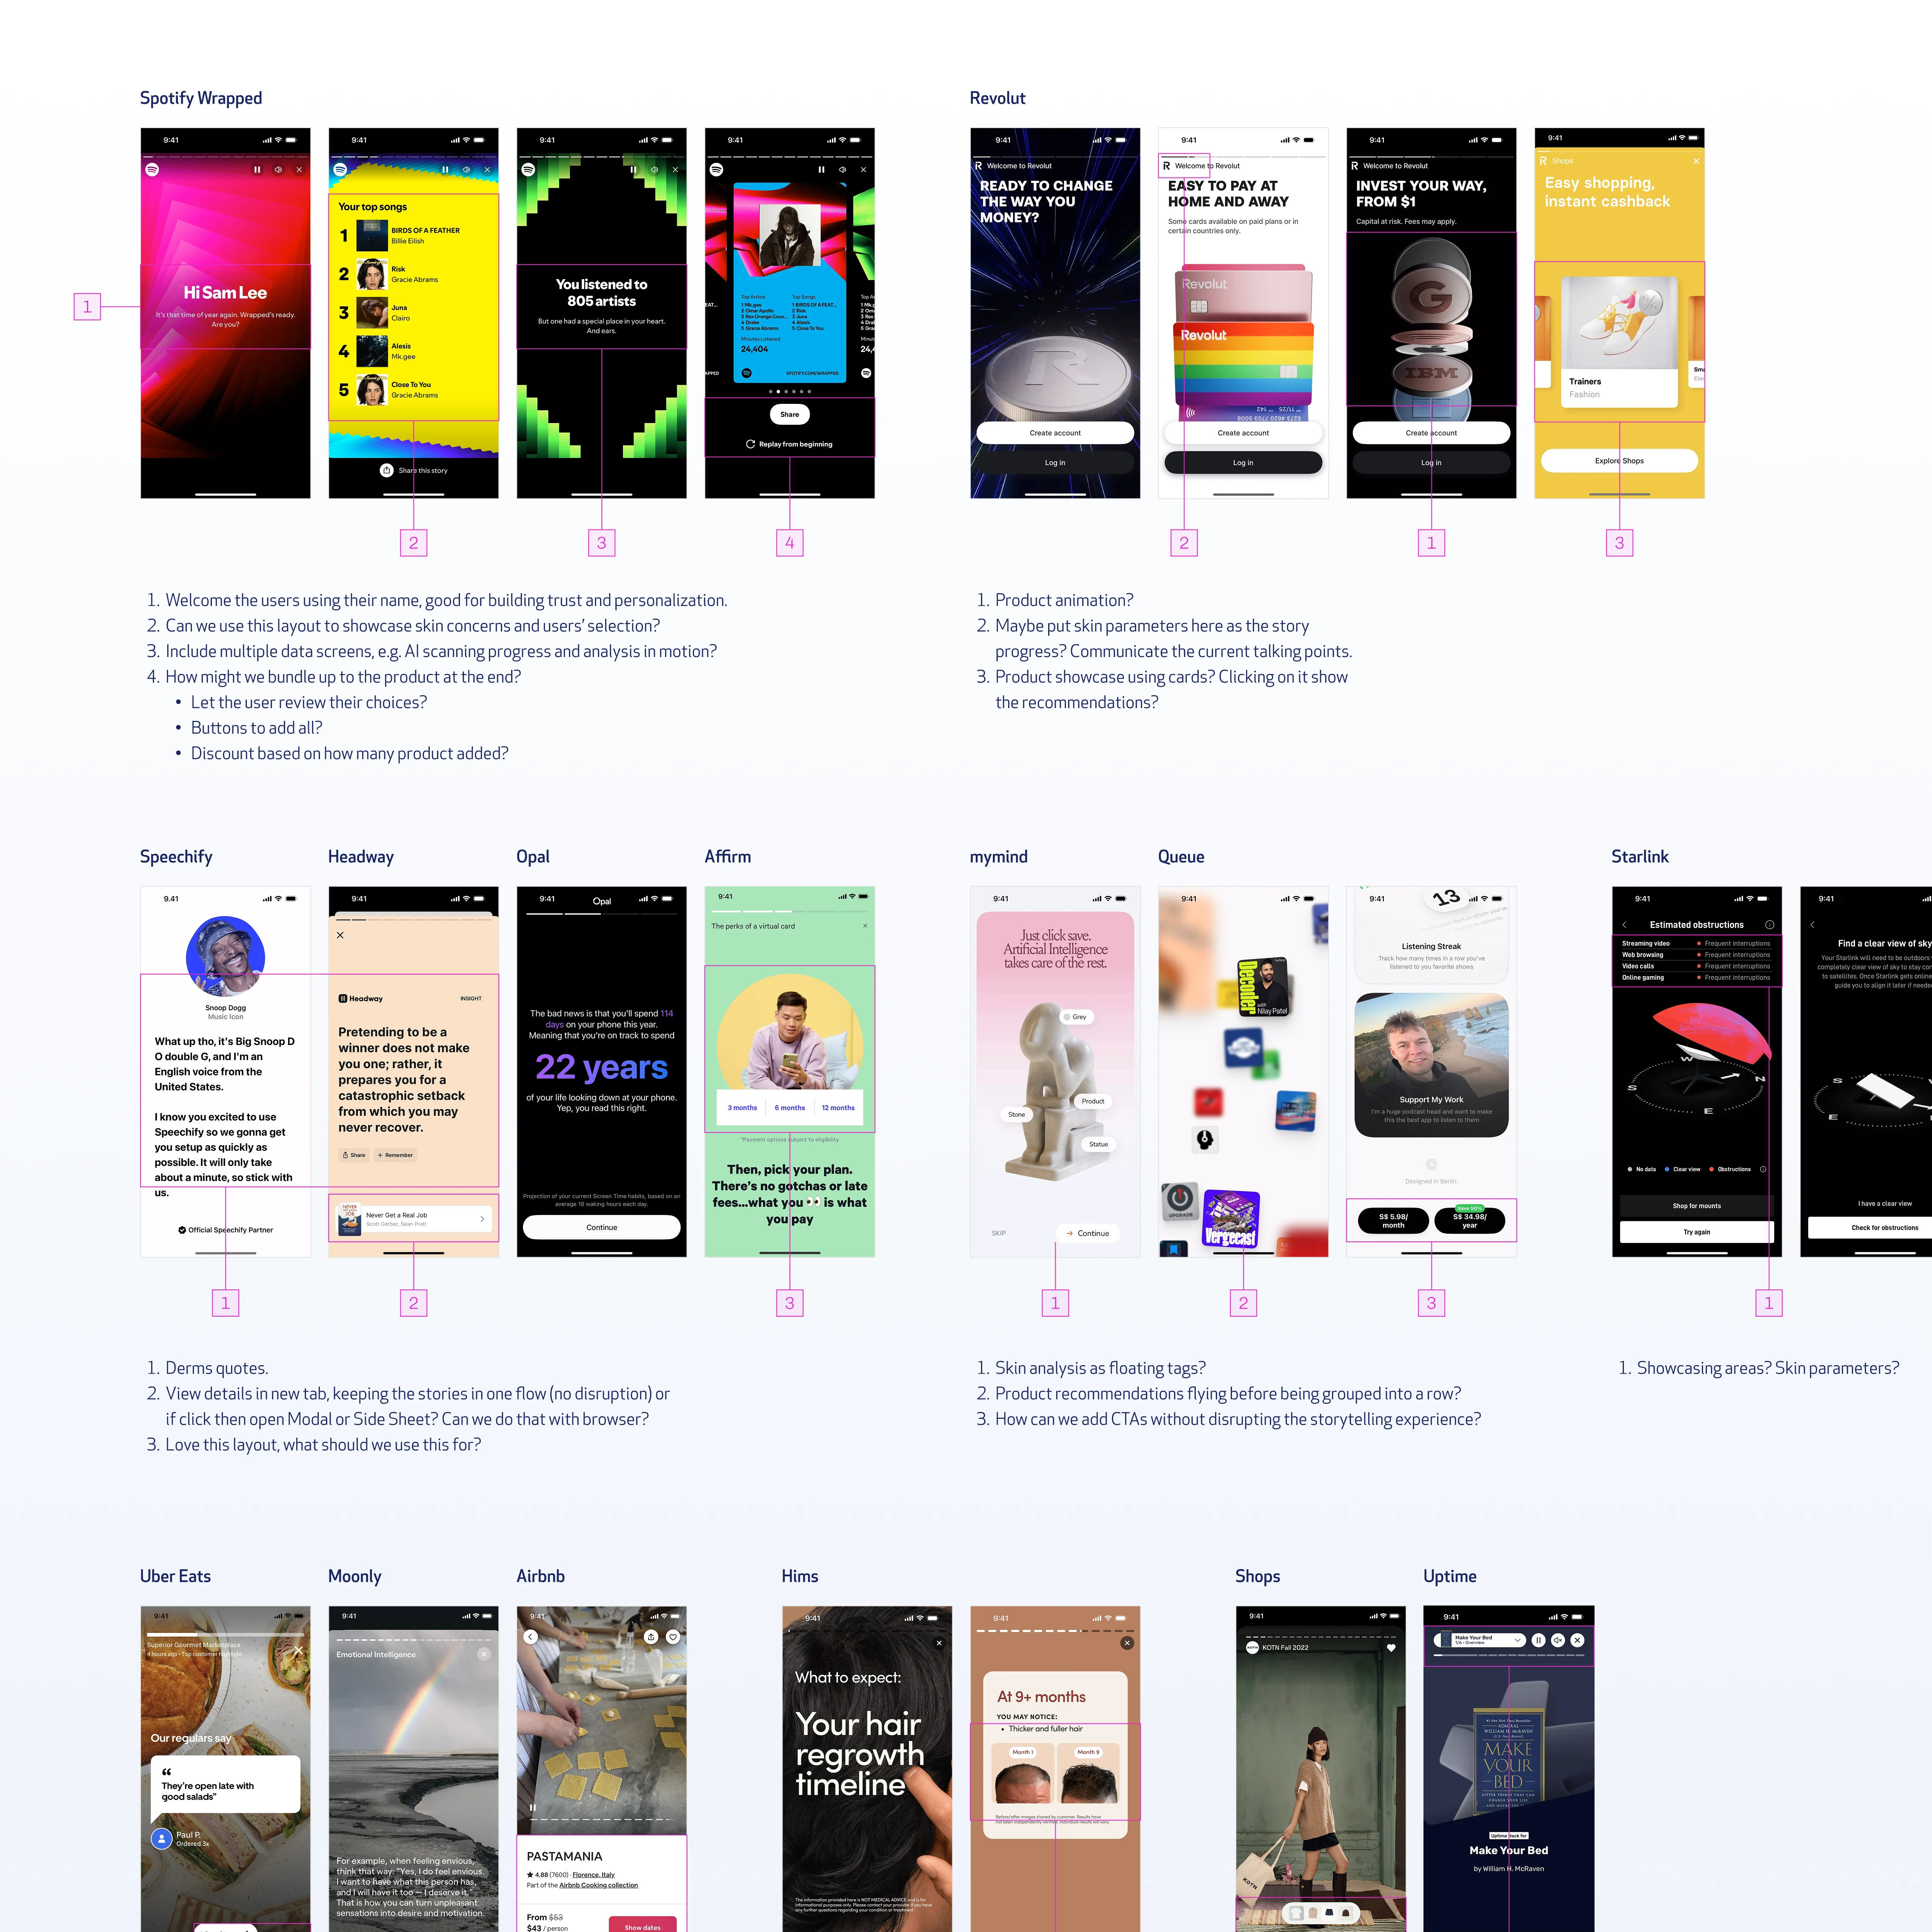
Visual Research

That was the aha moment. From there I dived further into similar UX patterns.

How does onboarding work at its best? How does Instagram Stories hold attention without asking for anything? The throughline across all of it: sequential, full-screen, one idea at a time, designed for people who scan rather than read. That became the design reference stack for the skin report.
Obagi case study, image 33
Obagi case study, image 34

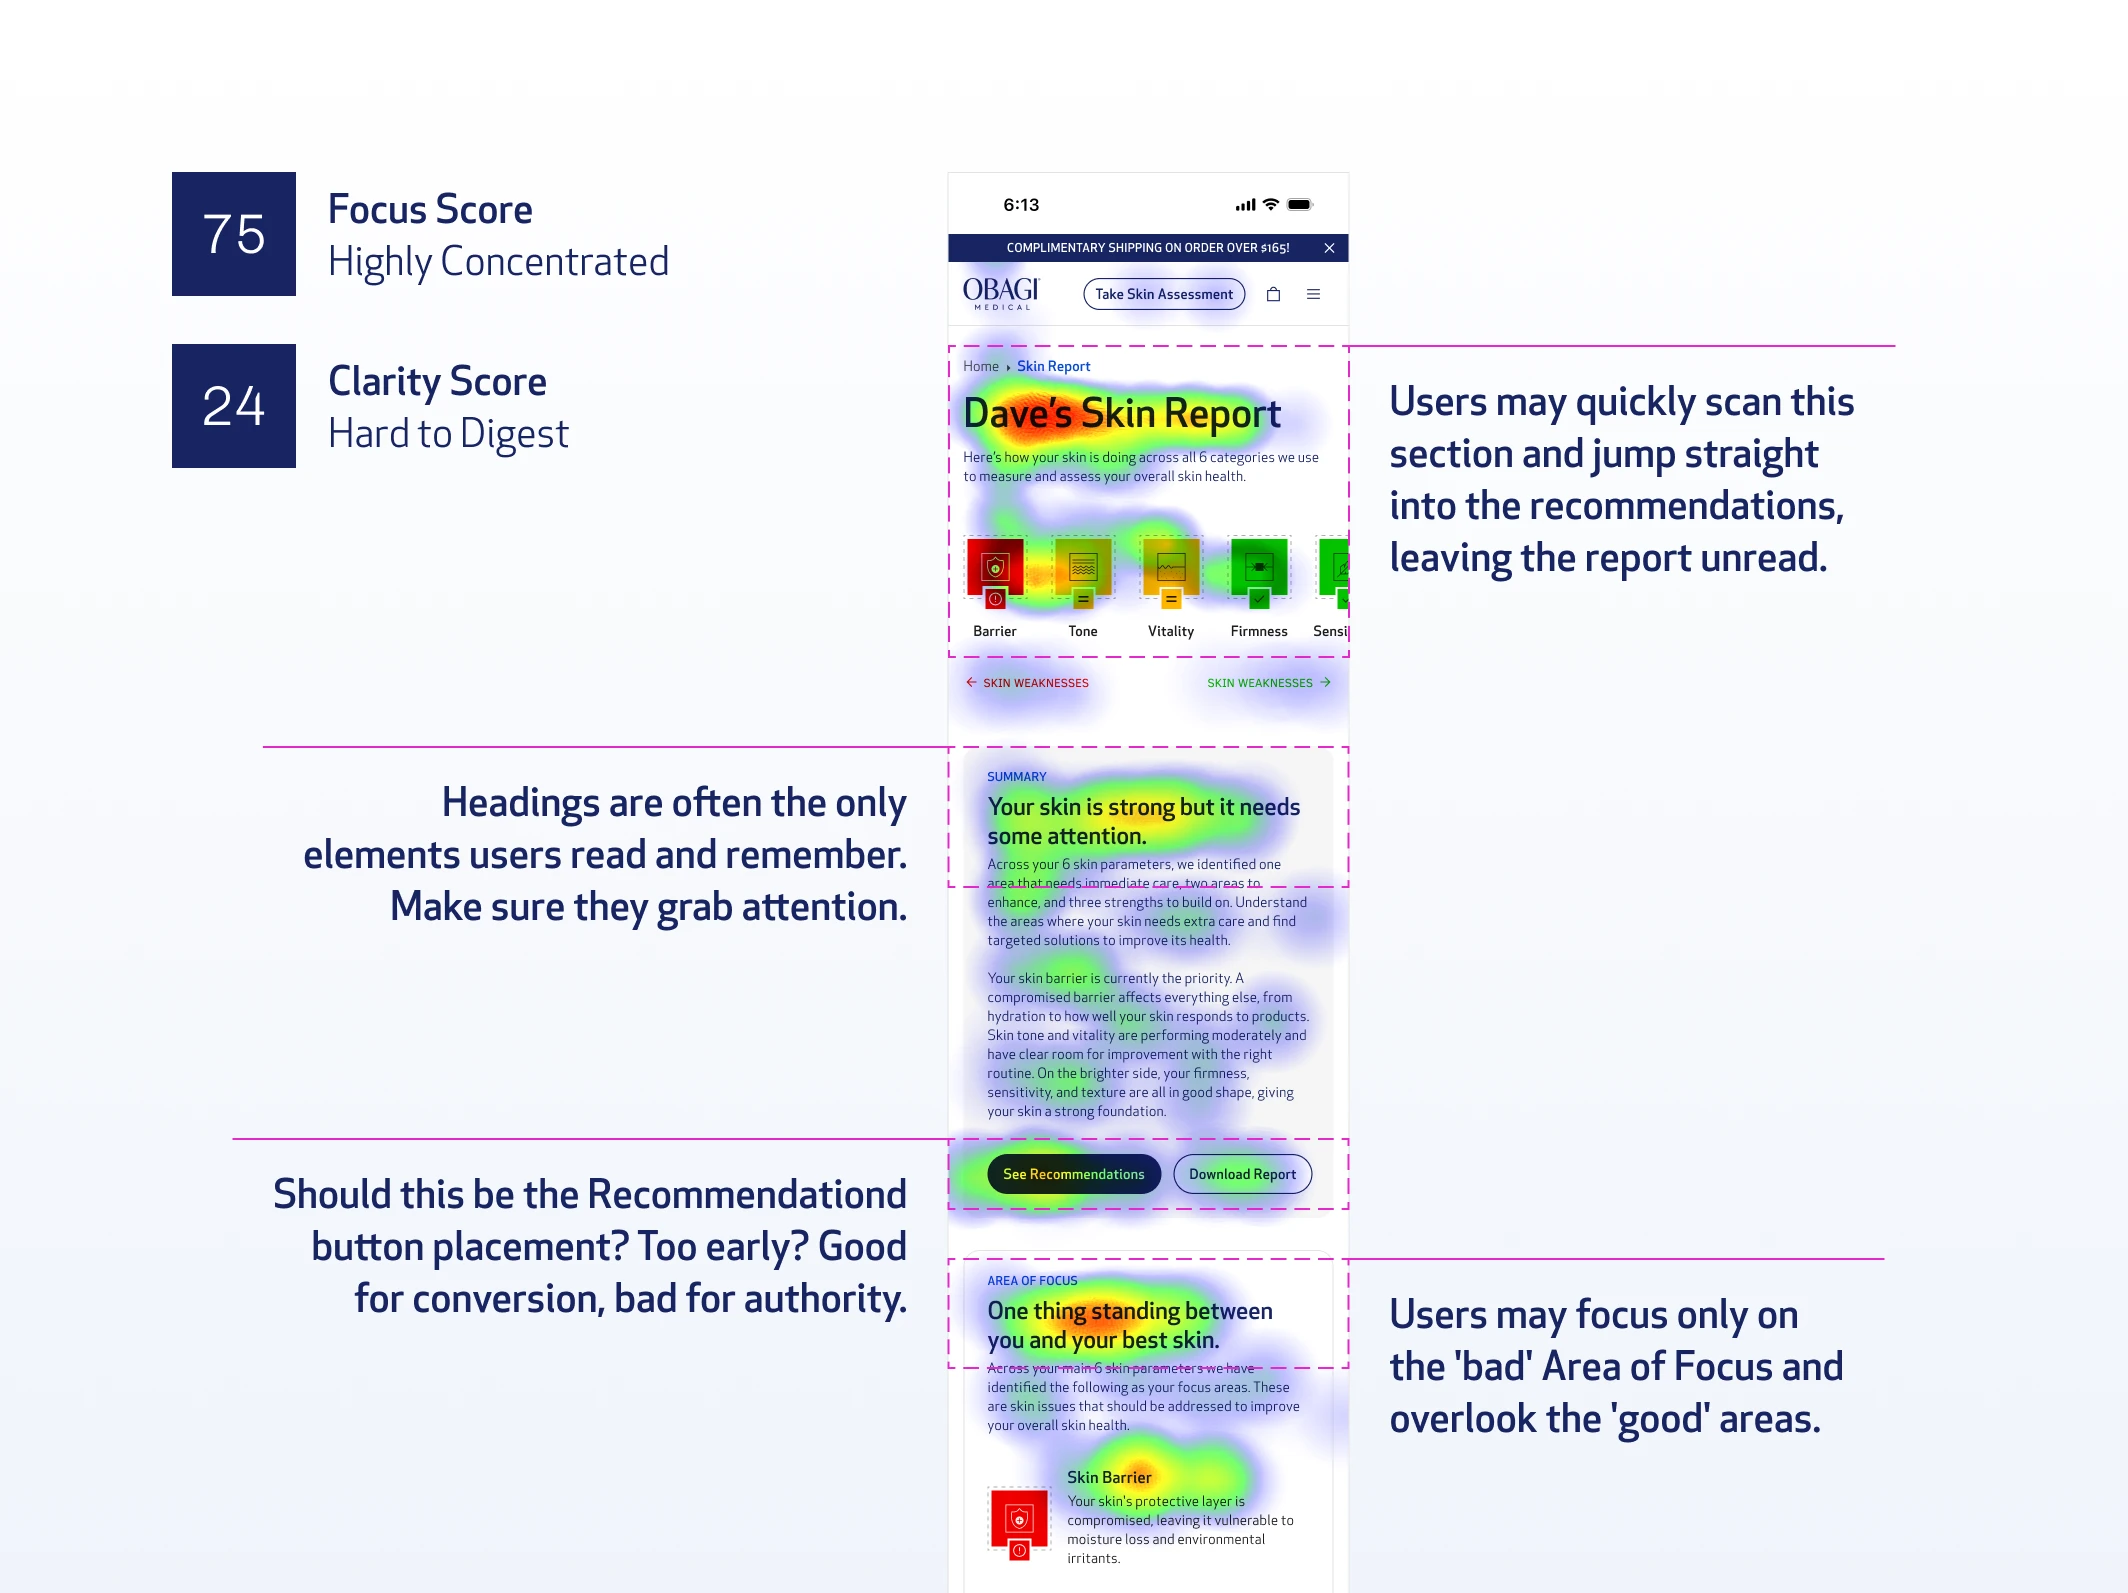
Hypothetical Heatmap (by Attention Insights)

Users don't read. They scan. So design for scanning, not reading. And if you want them to stay engaged long enough to reach the product recommendation, give them something worth experiencing - not something worth skipping. That was the moment the story format stopped being a reference and became the answer.

Users come out of a 25-question assessment and a face scan. They've already invested time. They have a stated concern. The system has findings. The job isn't to dump all of that onto a page. The job is to take them on a journey from "here's what you told us" to "here's what we found" to "here's what to do."
Obagi case study, image 35
Obagi case study, image 36

Iterations with New Approach

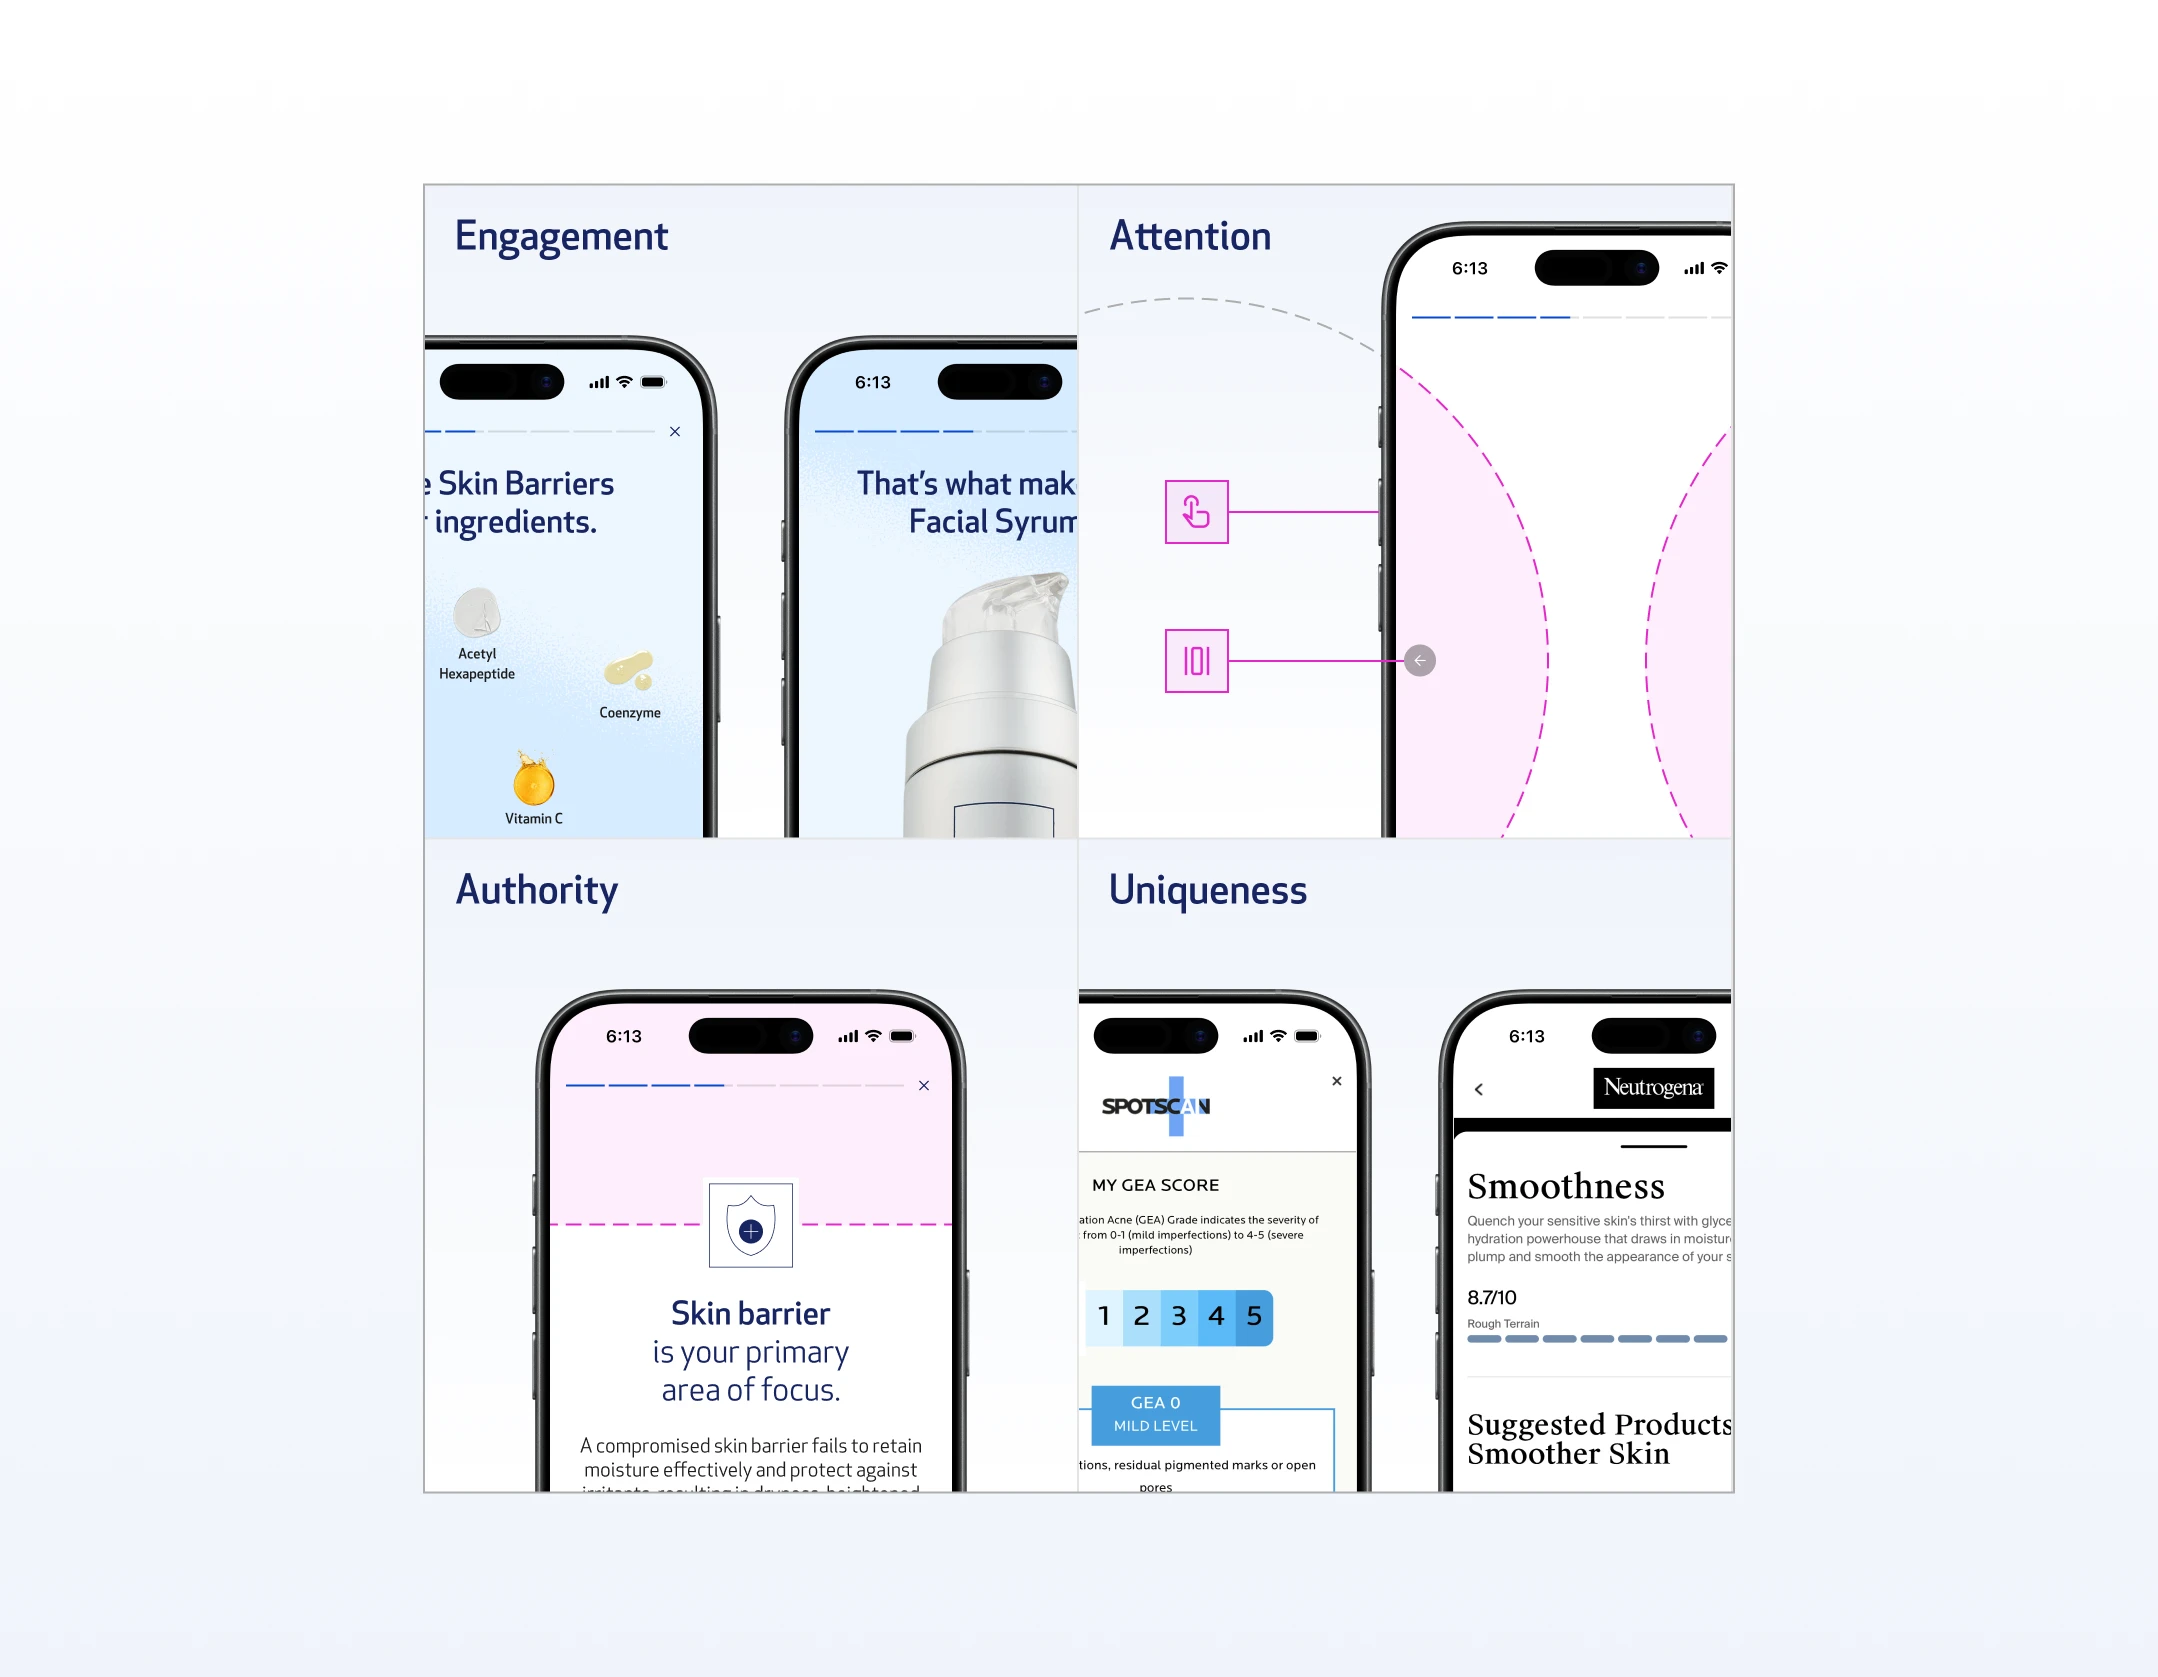
The reason Spotify Wrapped and Instagram Stories UX patterns answered four problems at once:

Engagement

auto-advancing, animated, full-screen, low users effort.

Attention-grabbing

one idea per frame means the user never has to decide what to focus on. They just tap.

Authority without overwhelm

clinical data can still be there, but sequenced into digestible moments rather than stacked onto a single page.

Uniqueness

no other skincare brand was doing this. Every competitor was still on the same long-scroll report format. A story-driven skin report was a genuine differentiator, not just a UX improvement.
Obagi case study, image 37
Obagi case study, image 38

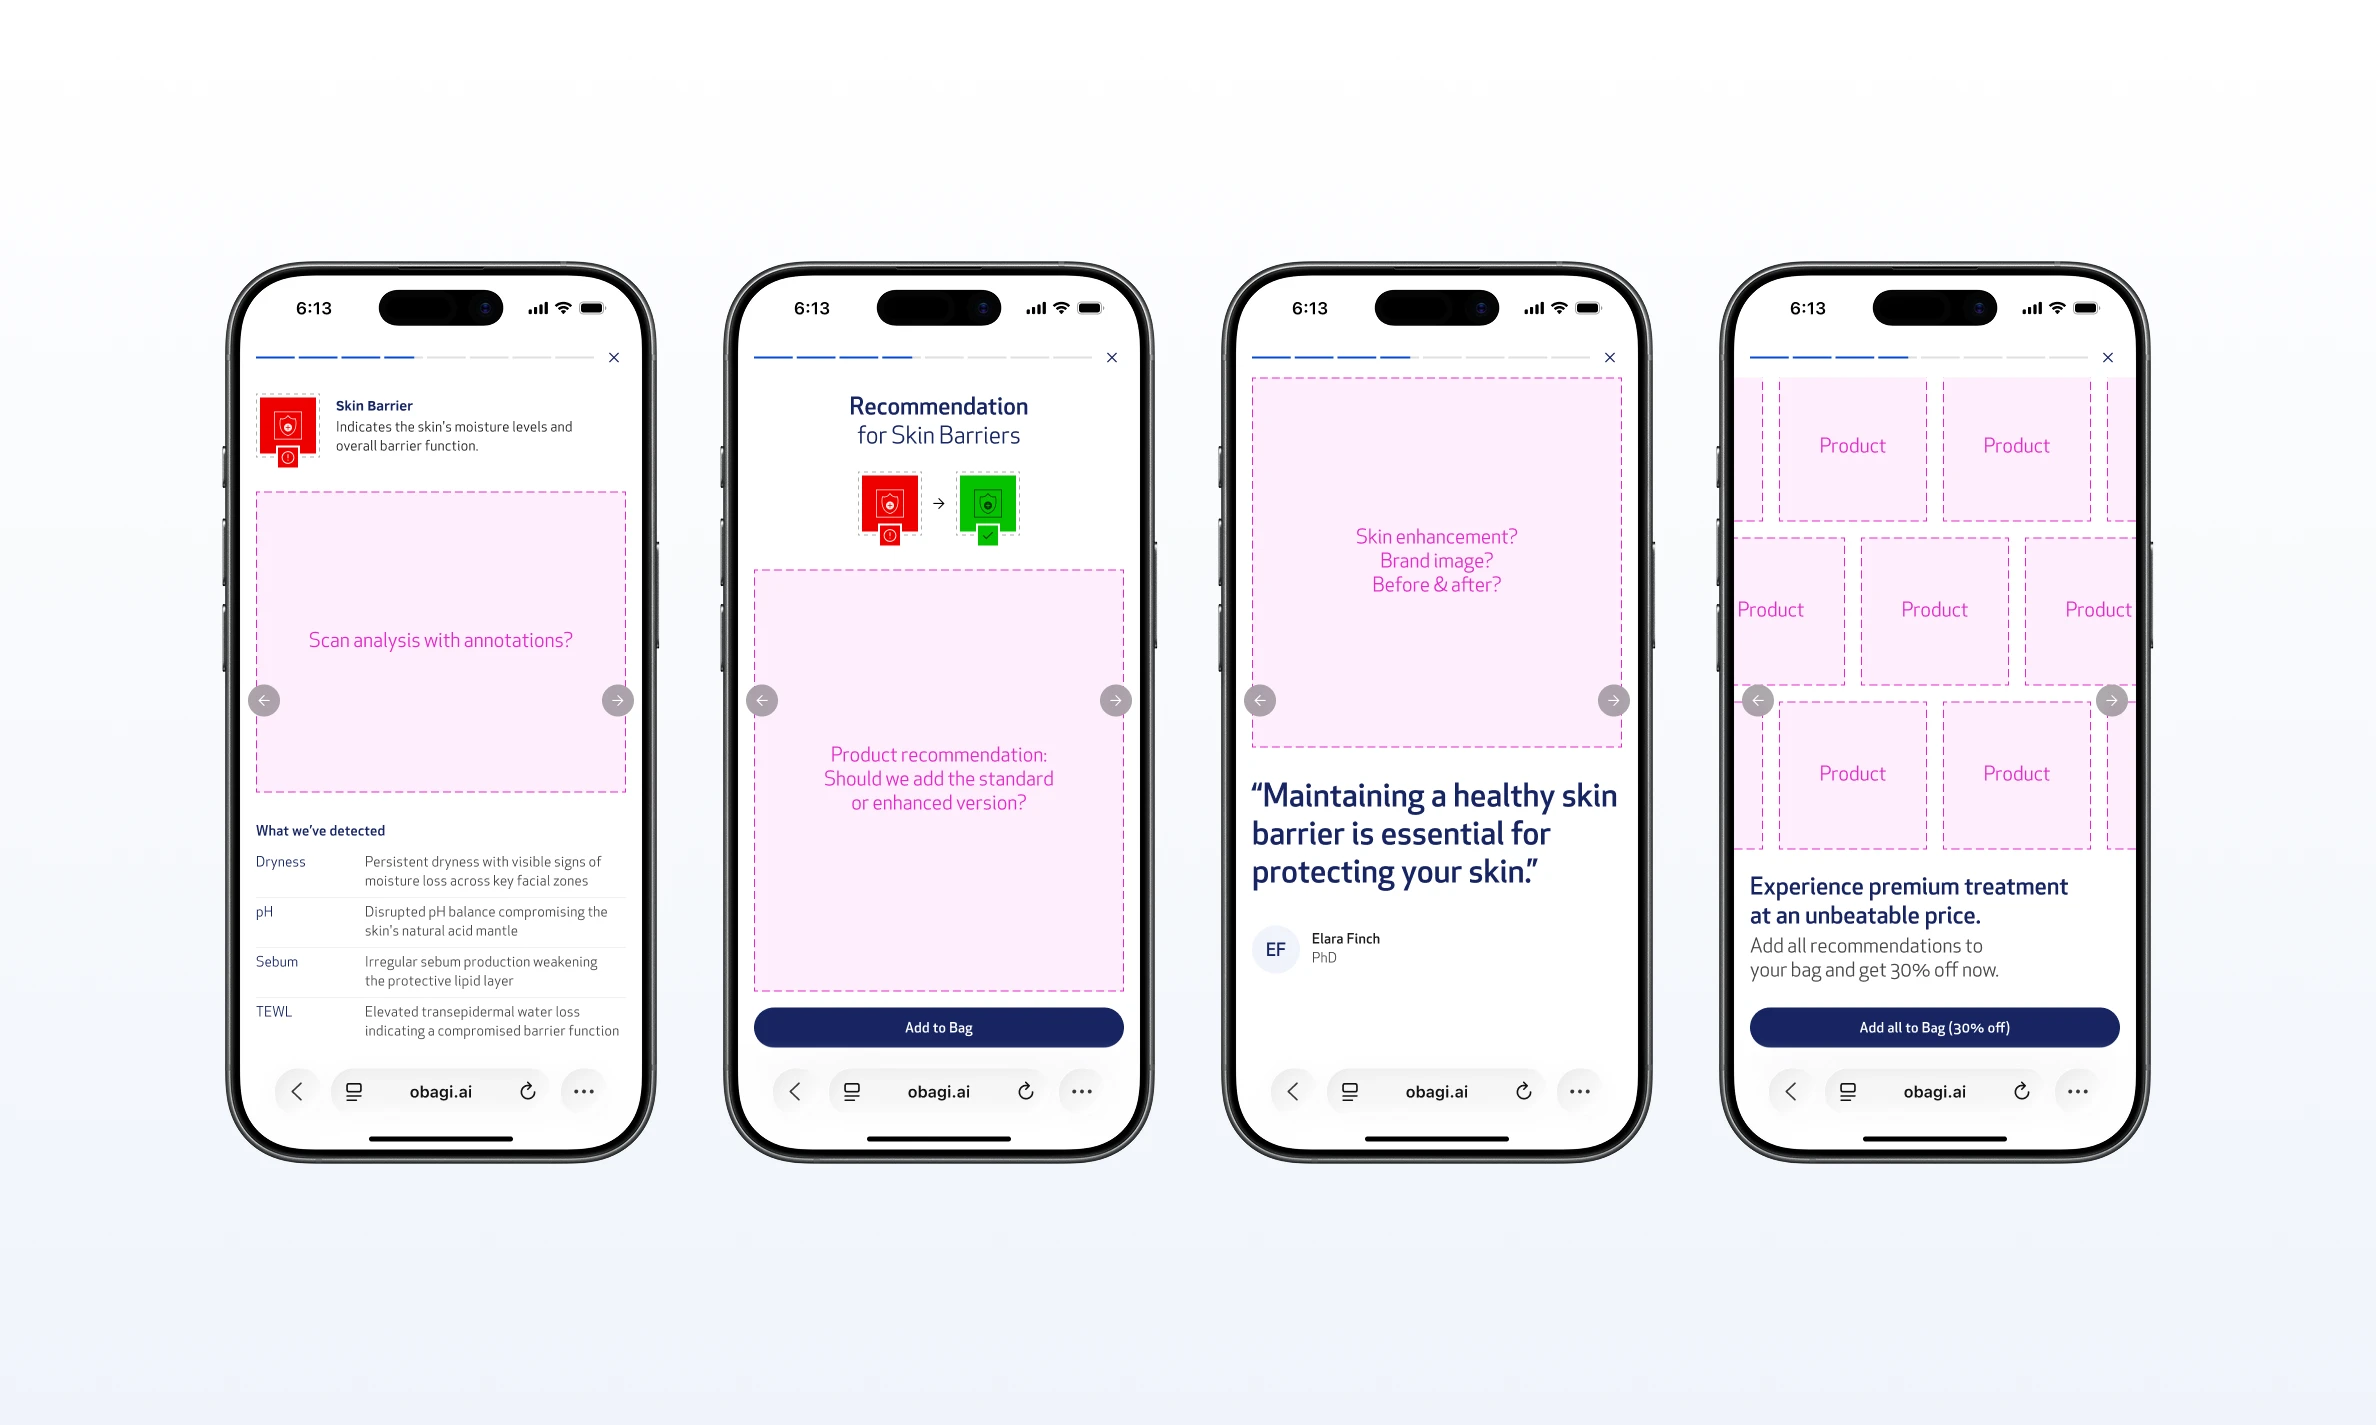
Draft Story Pattern Layout

And critically, the format is already familiar. Users know how Wrapped and Stories work. No learning curve, no friction, no cognitive load spent figuring out the interaction. They just experience it.

That's exactly what the skin report needed to do.

Solution

A story format that sequences data the way people actually consume content.

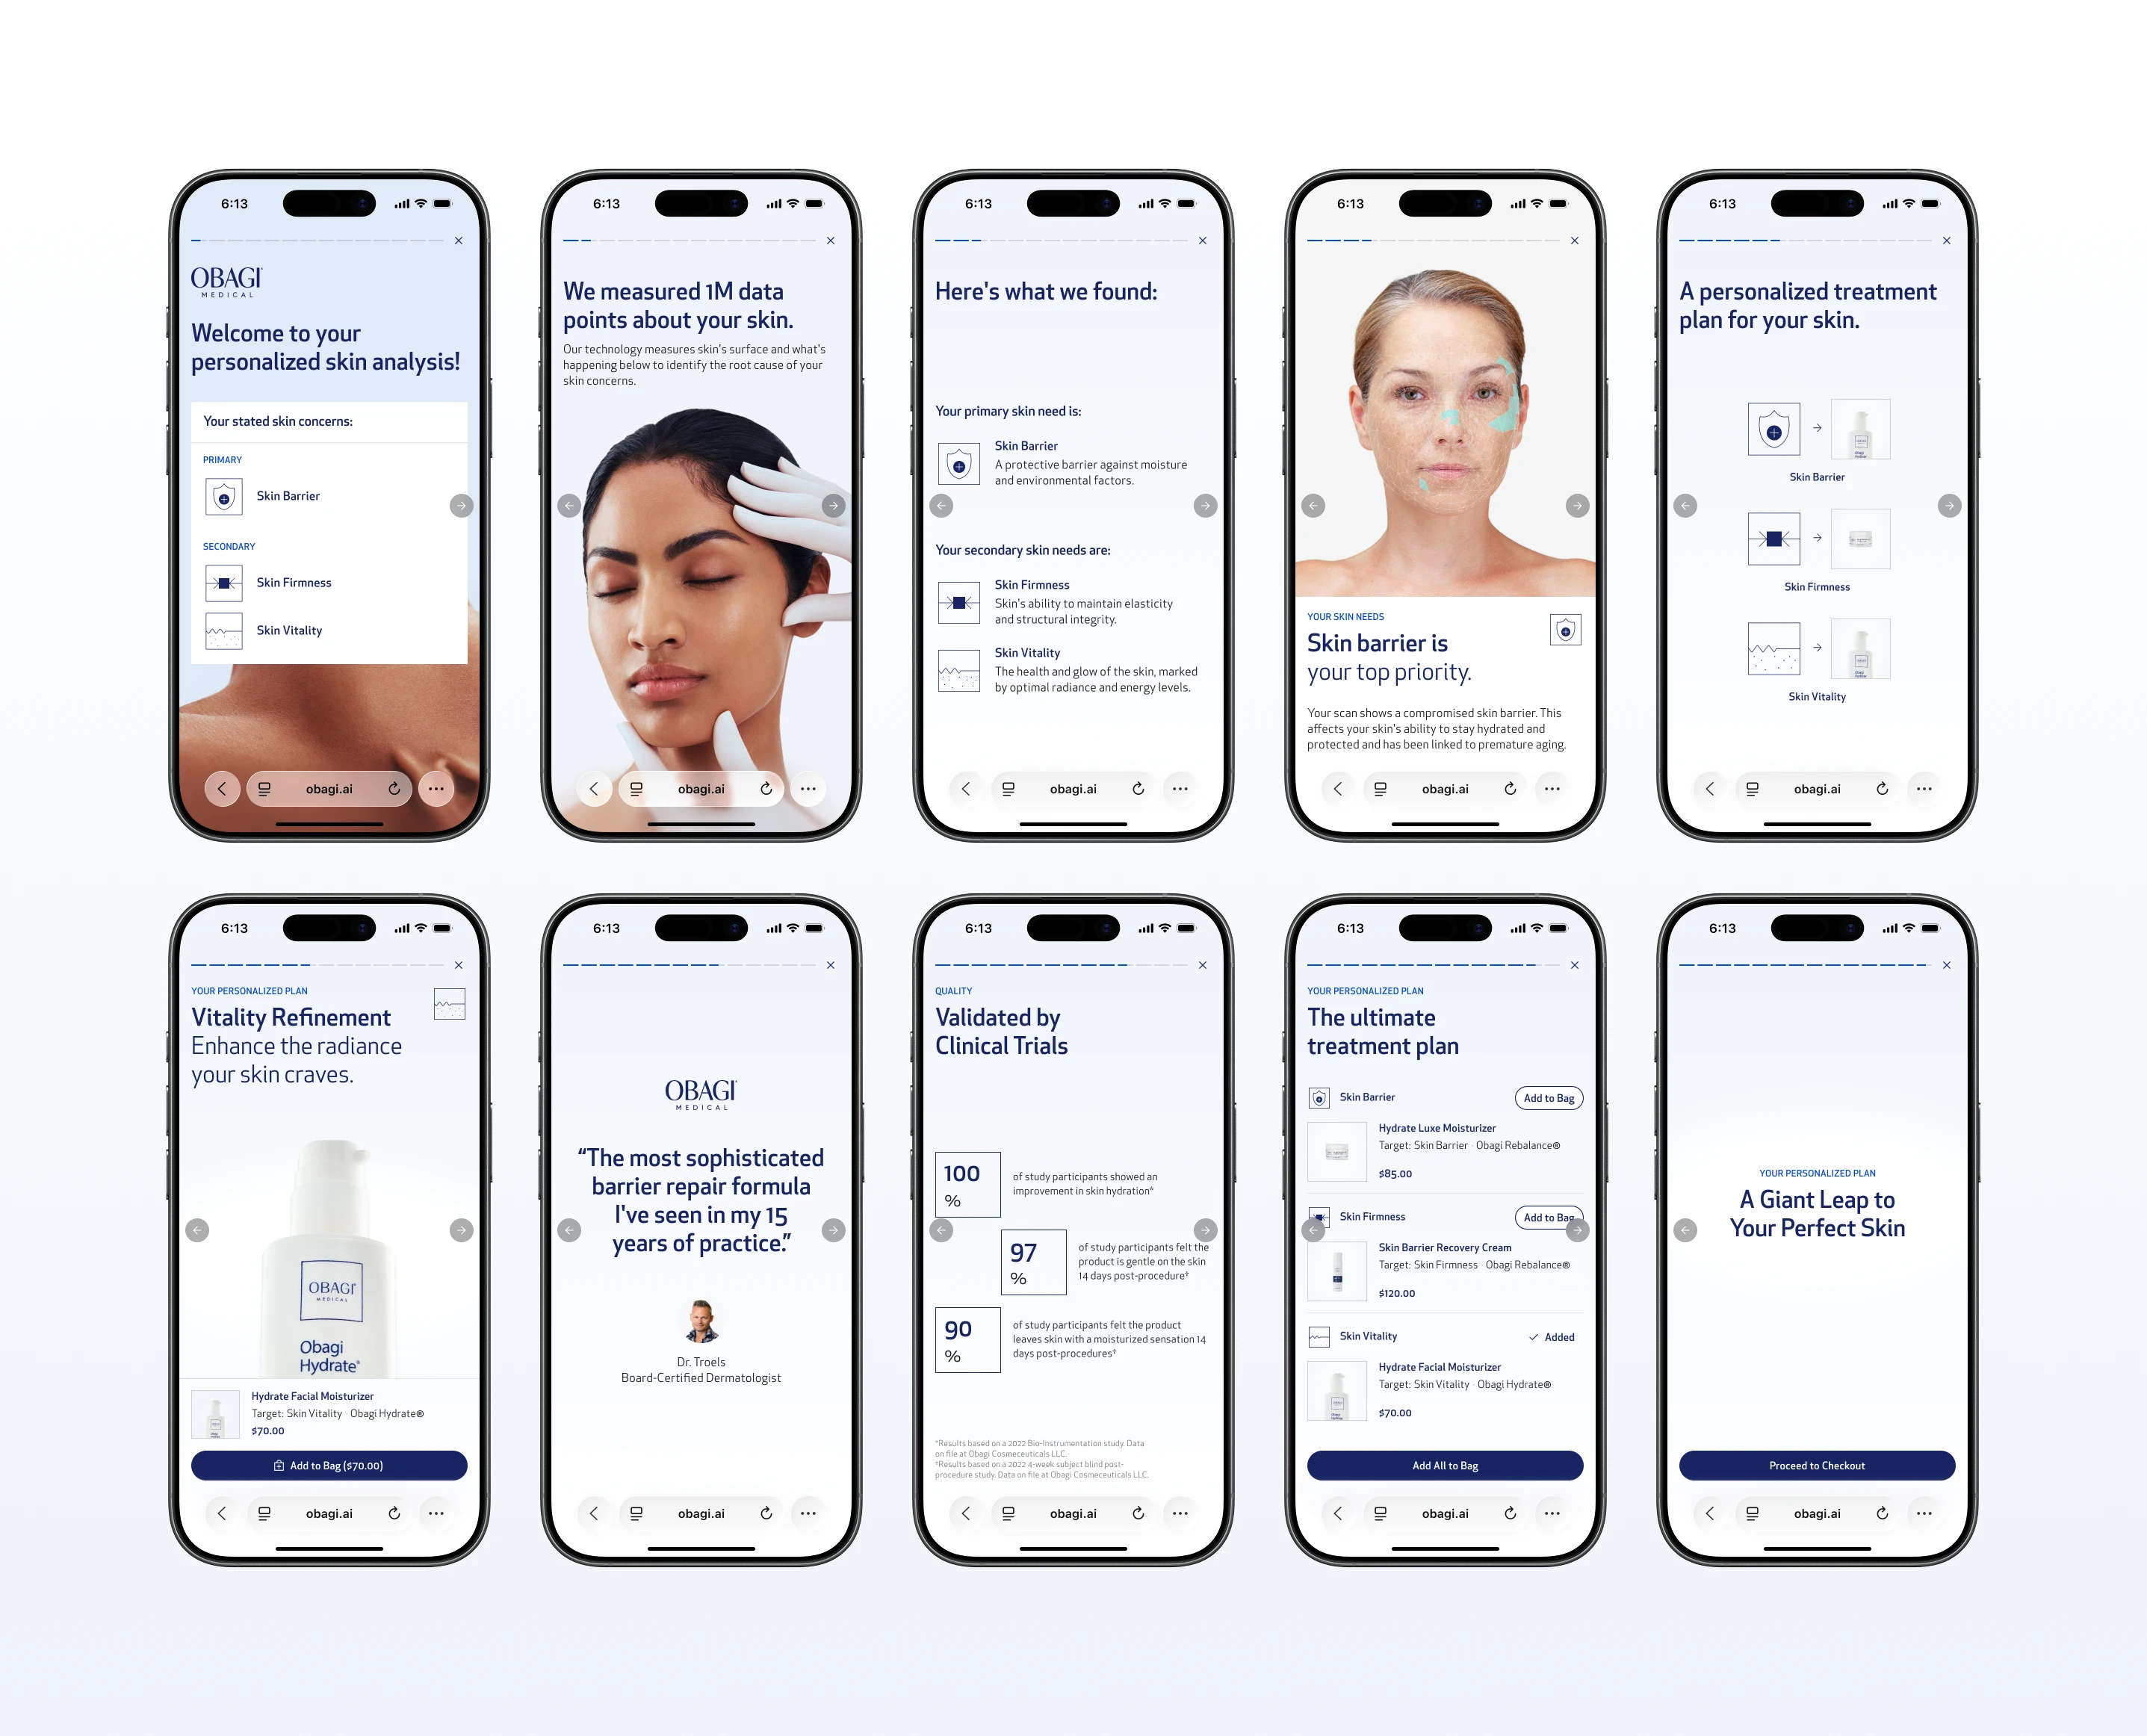
The story functions like an Instagram Story: full-screen, tap left or right to navigate, auto-advancing with animation. No scrolling required. The user stays in the experience rather than managing a page.
Obagi case study, image 39
Obagi case study, image 40

The Finals

The sequence was designed with a specific logic:
Obagi case study, image 41
Obagi case study, image 42

Welcome Screens

Welcome screen

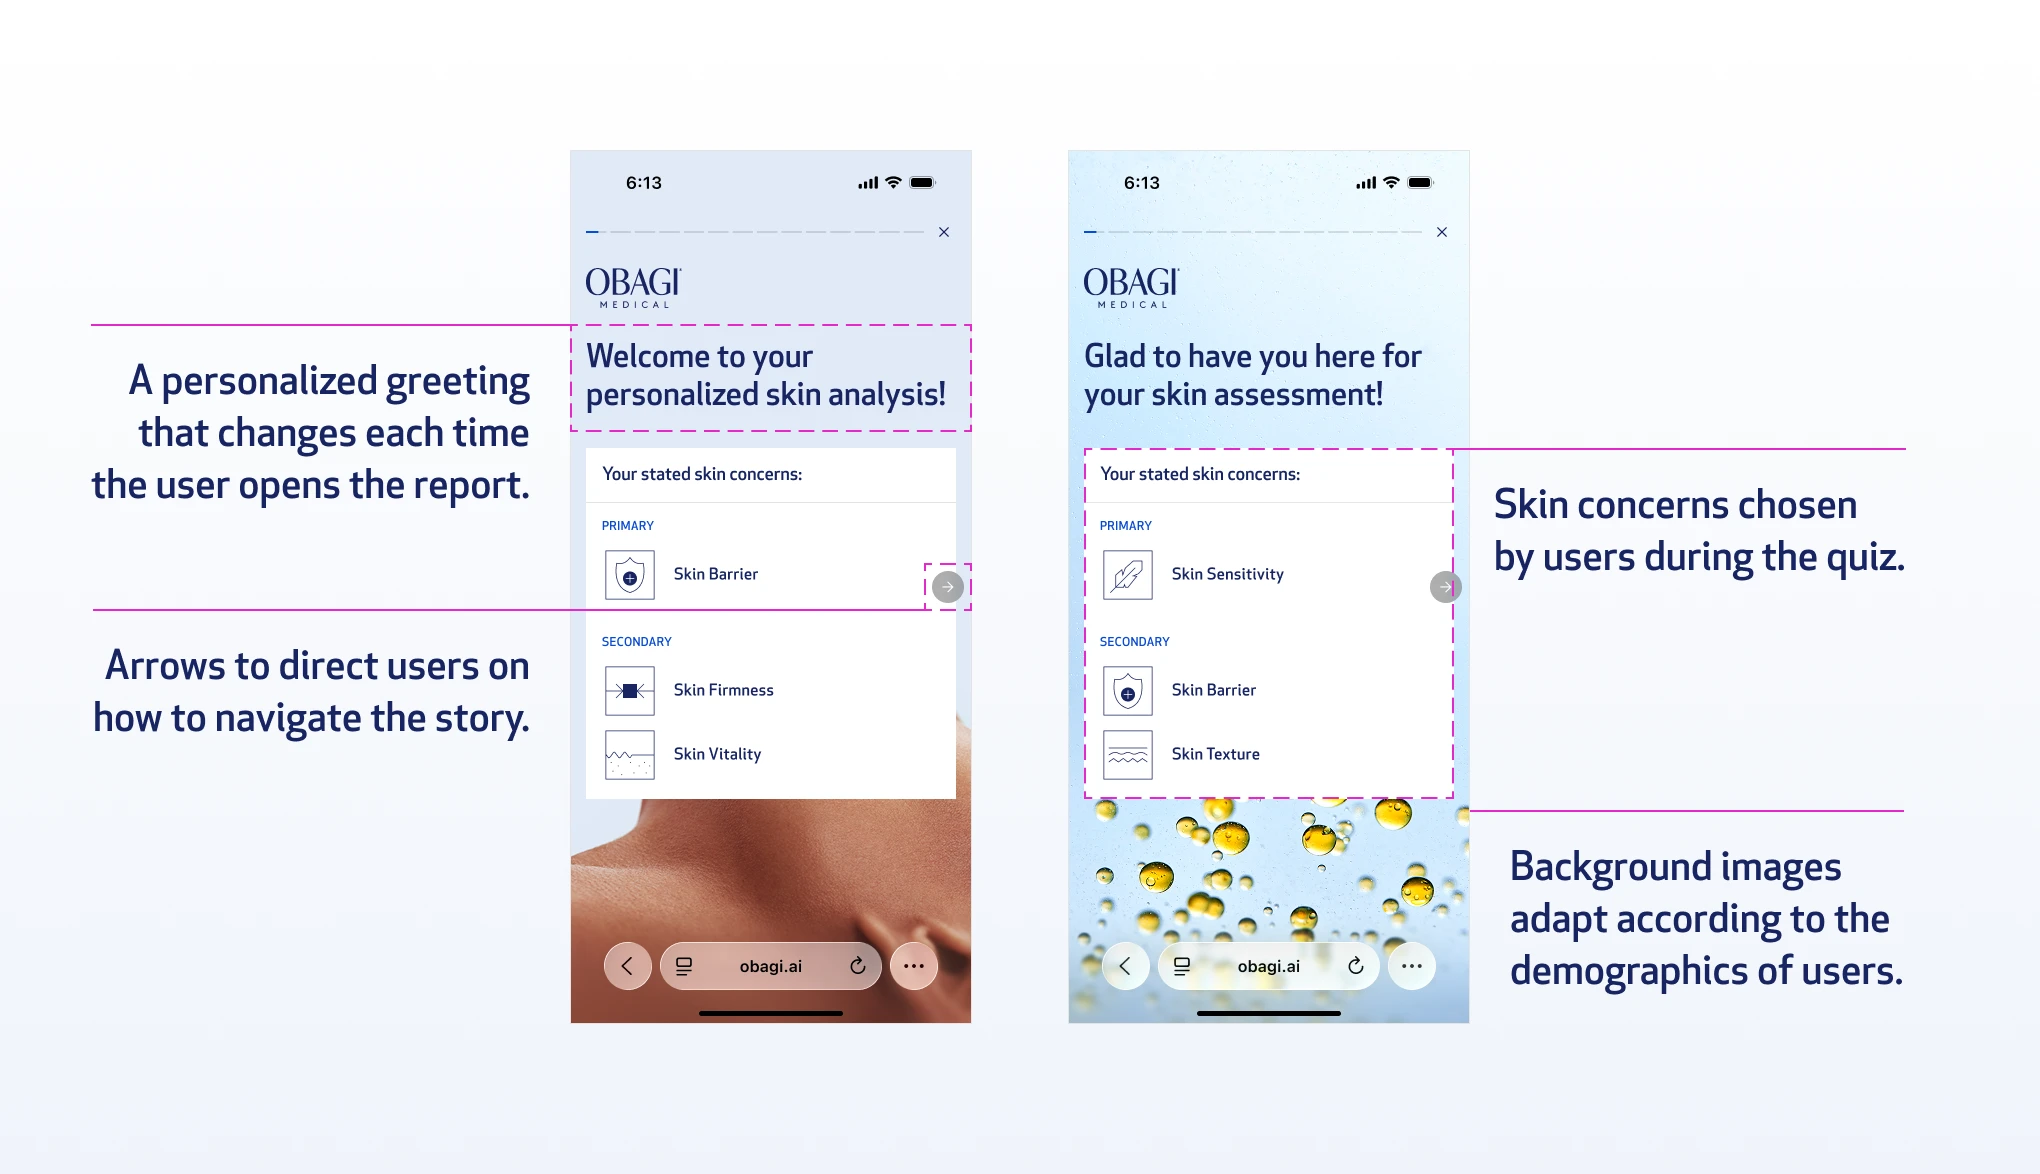
It opens with the user's stated skin concern from the quiz. Immediate relevance. You see yourself in the first frame.
Obagi case study, image 43
Obagi case study, image 44

Analysis Screen

Analysis screen

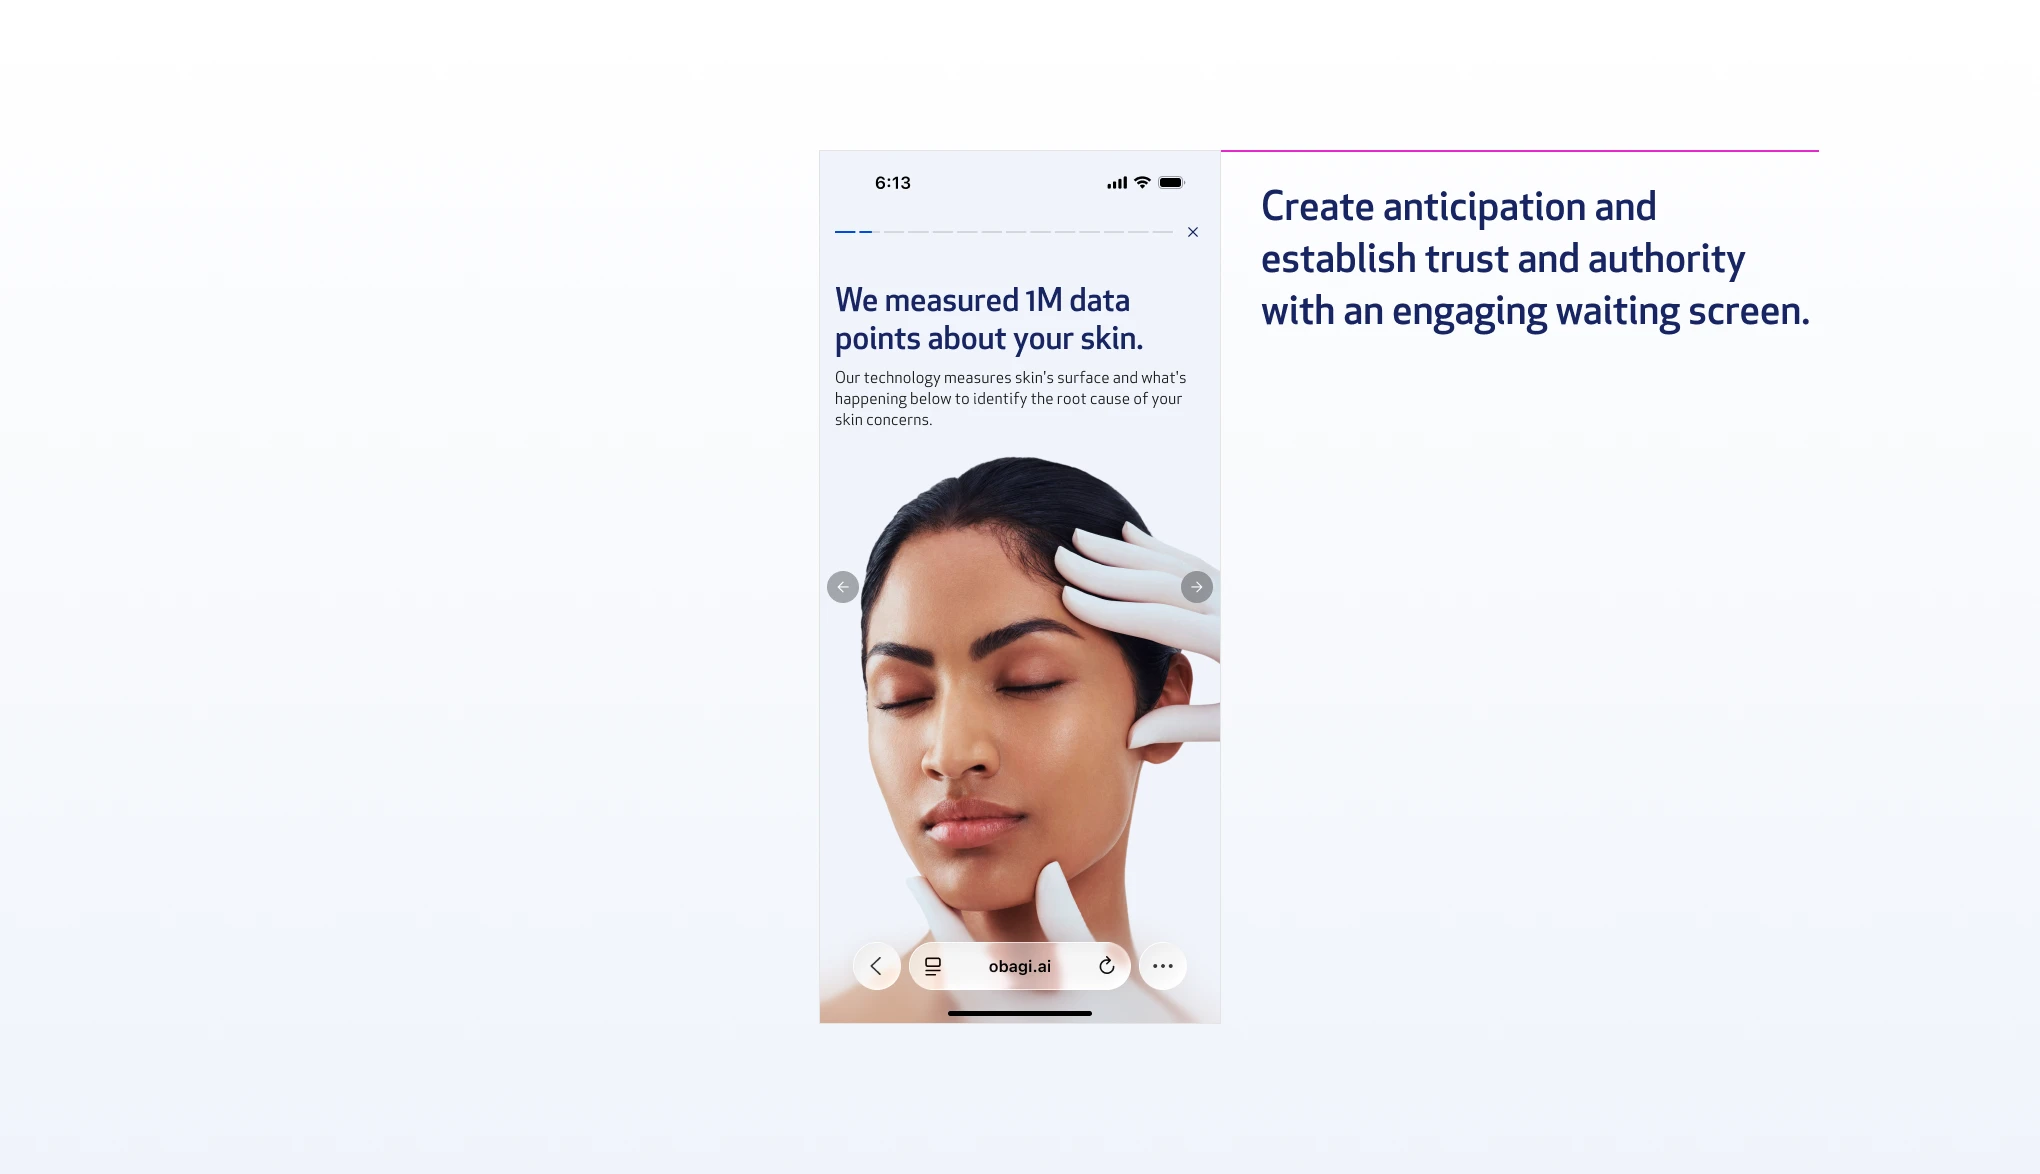
An engagement moment showing Obagi processing the scan data. Builds anticipation, establishes clinical authority without a word of jargon.
Obagi case study, image 45
Obagi case study, image 46

Concerns Screen

Primary and secondary concern screens

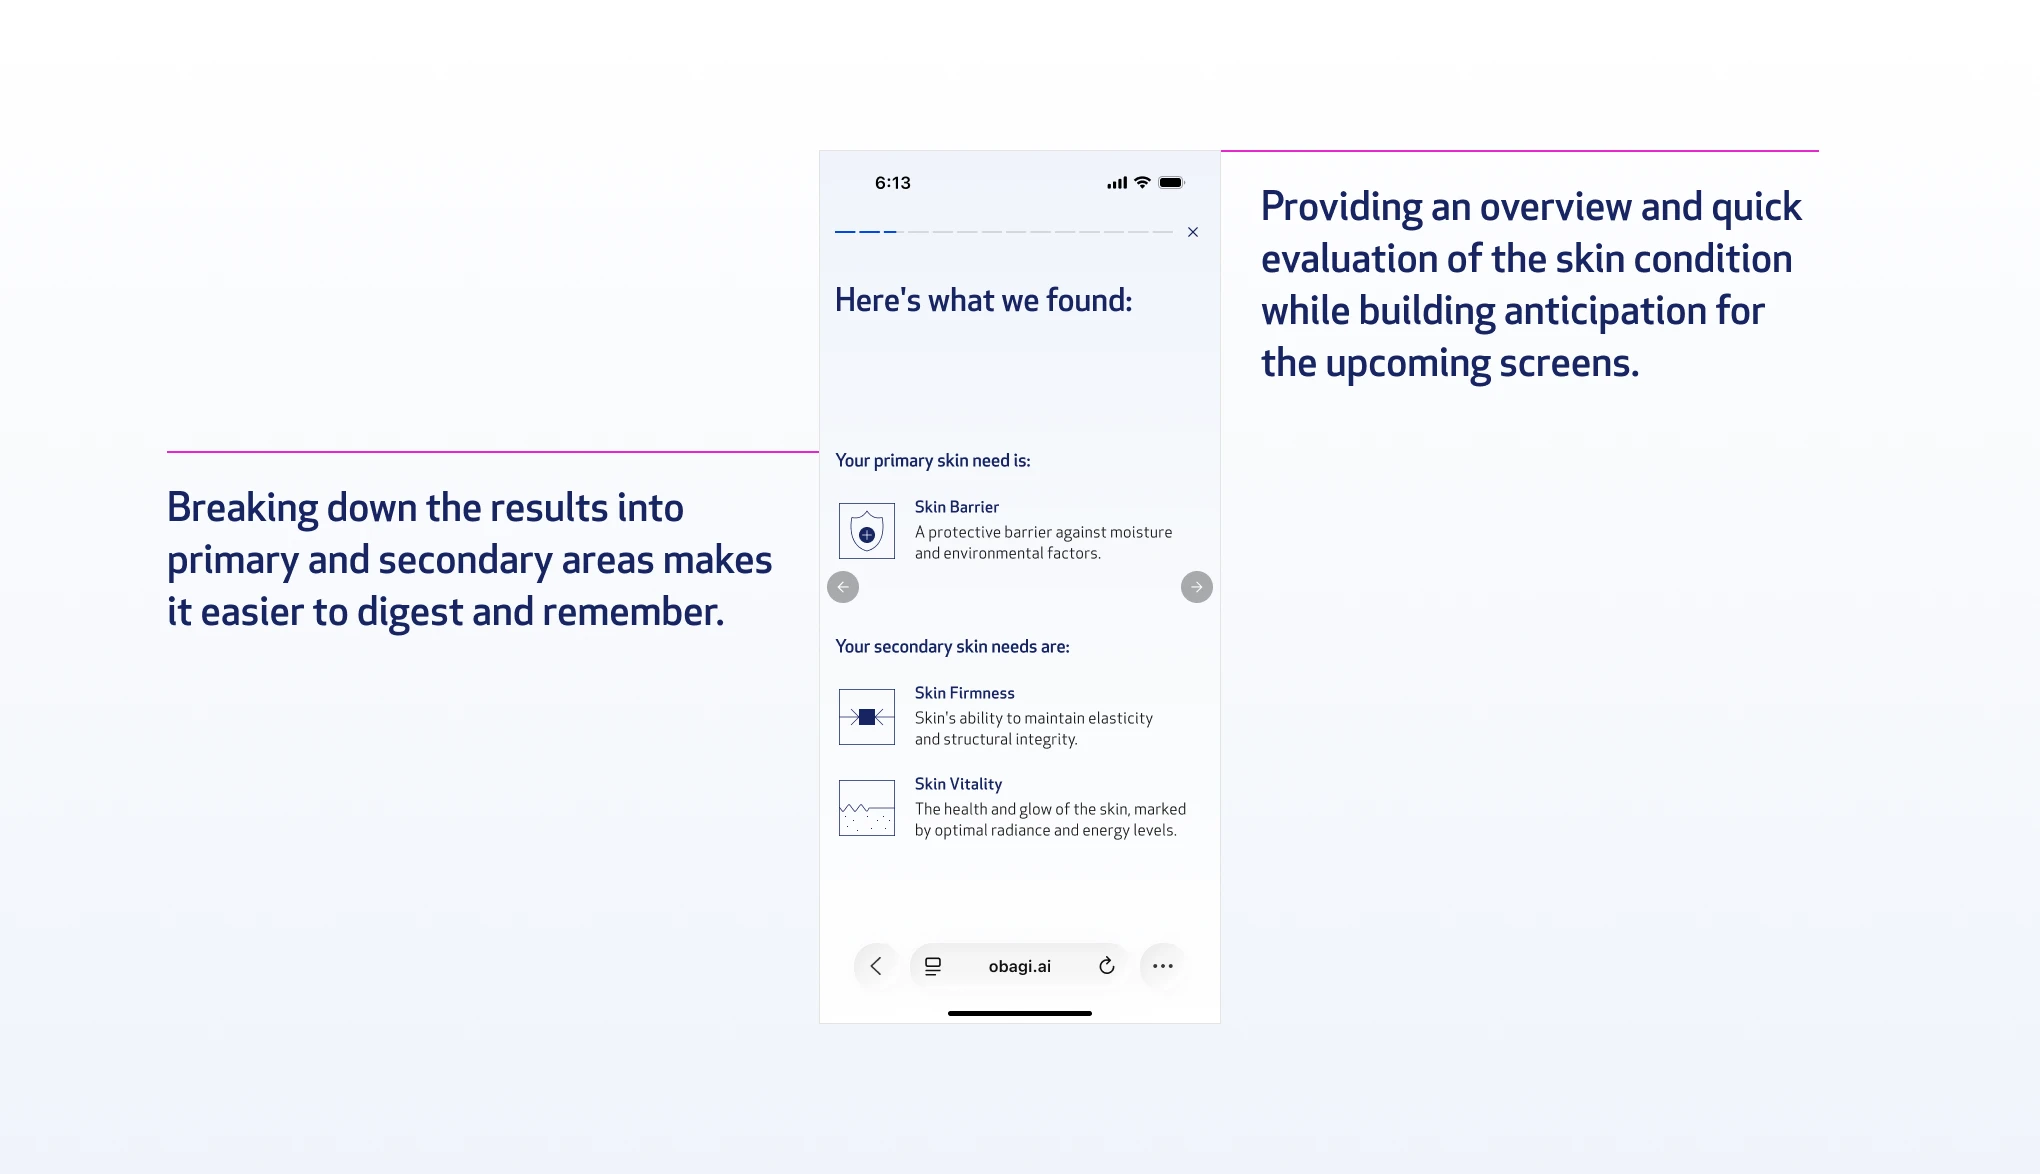
This explains each finding in plain language, matched to the scan data, not the user's self-diagnosis.
Obagi case study, image 47
Obagi case study, image 48

Findings Screens

Findings screen

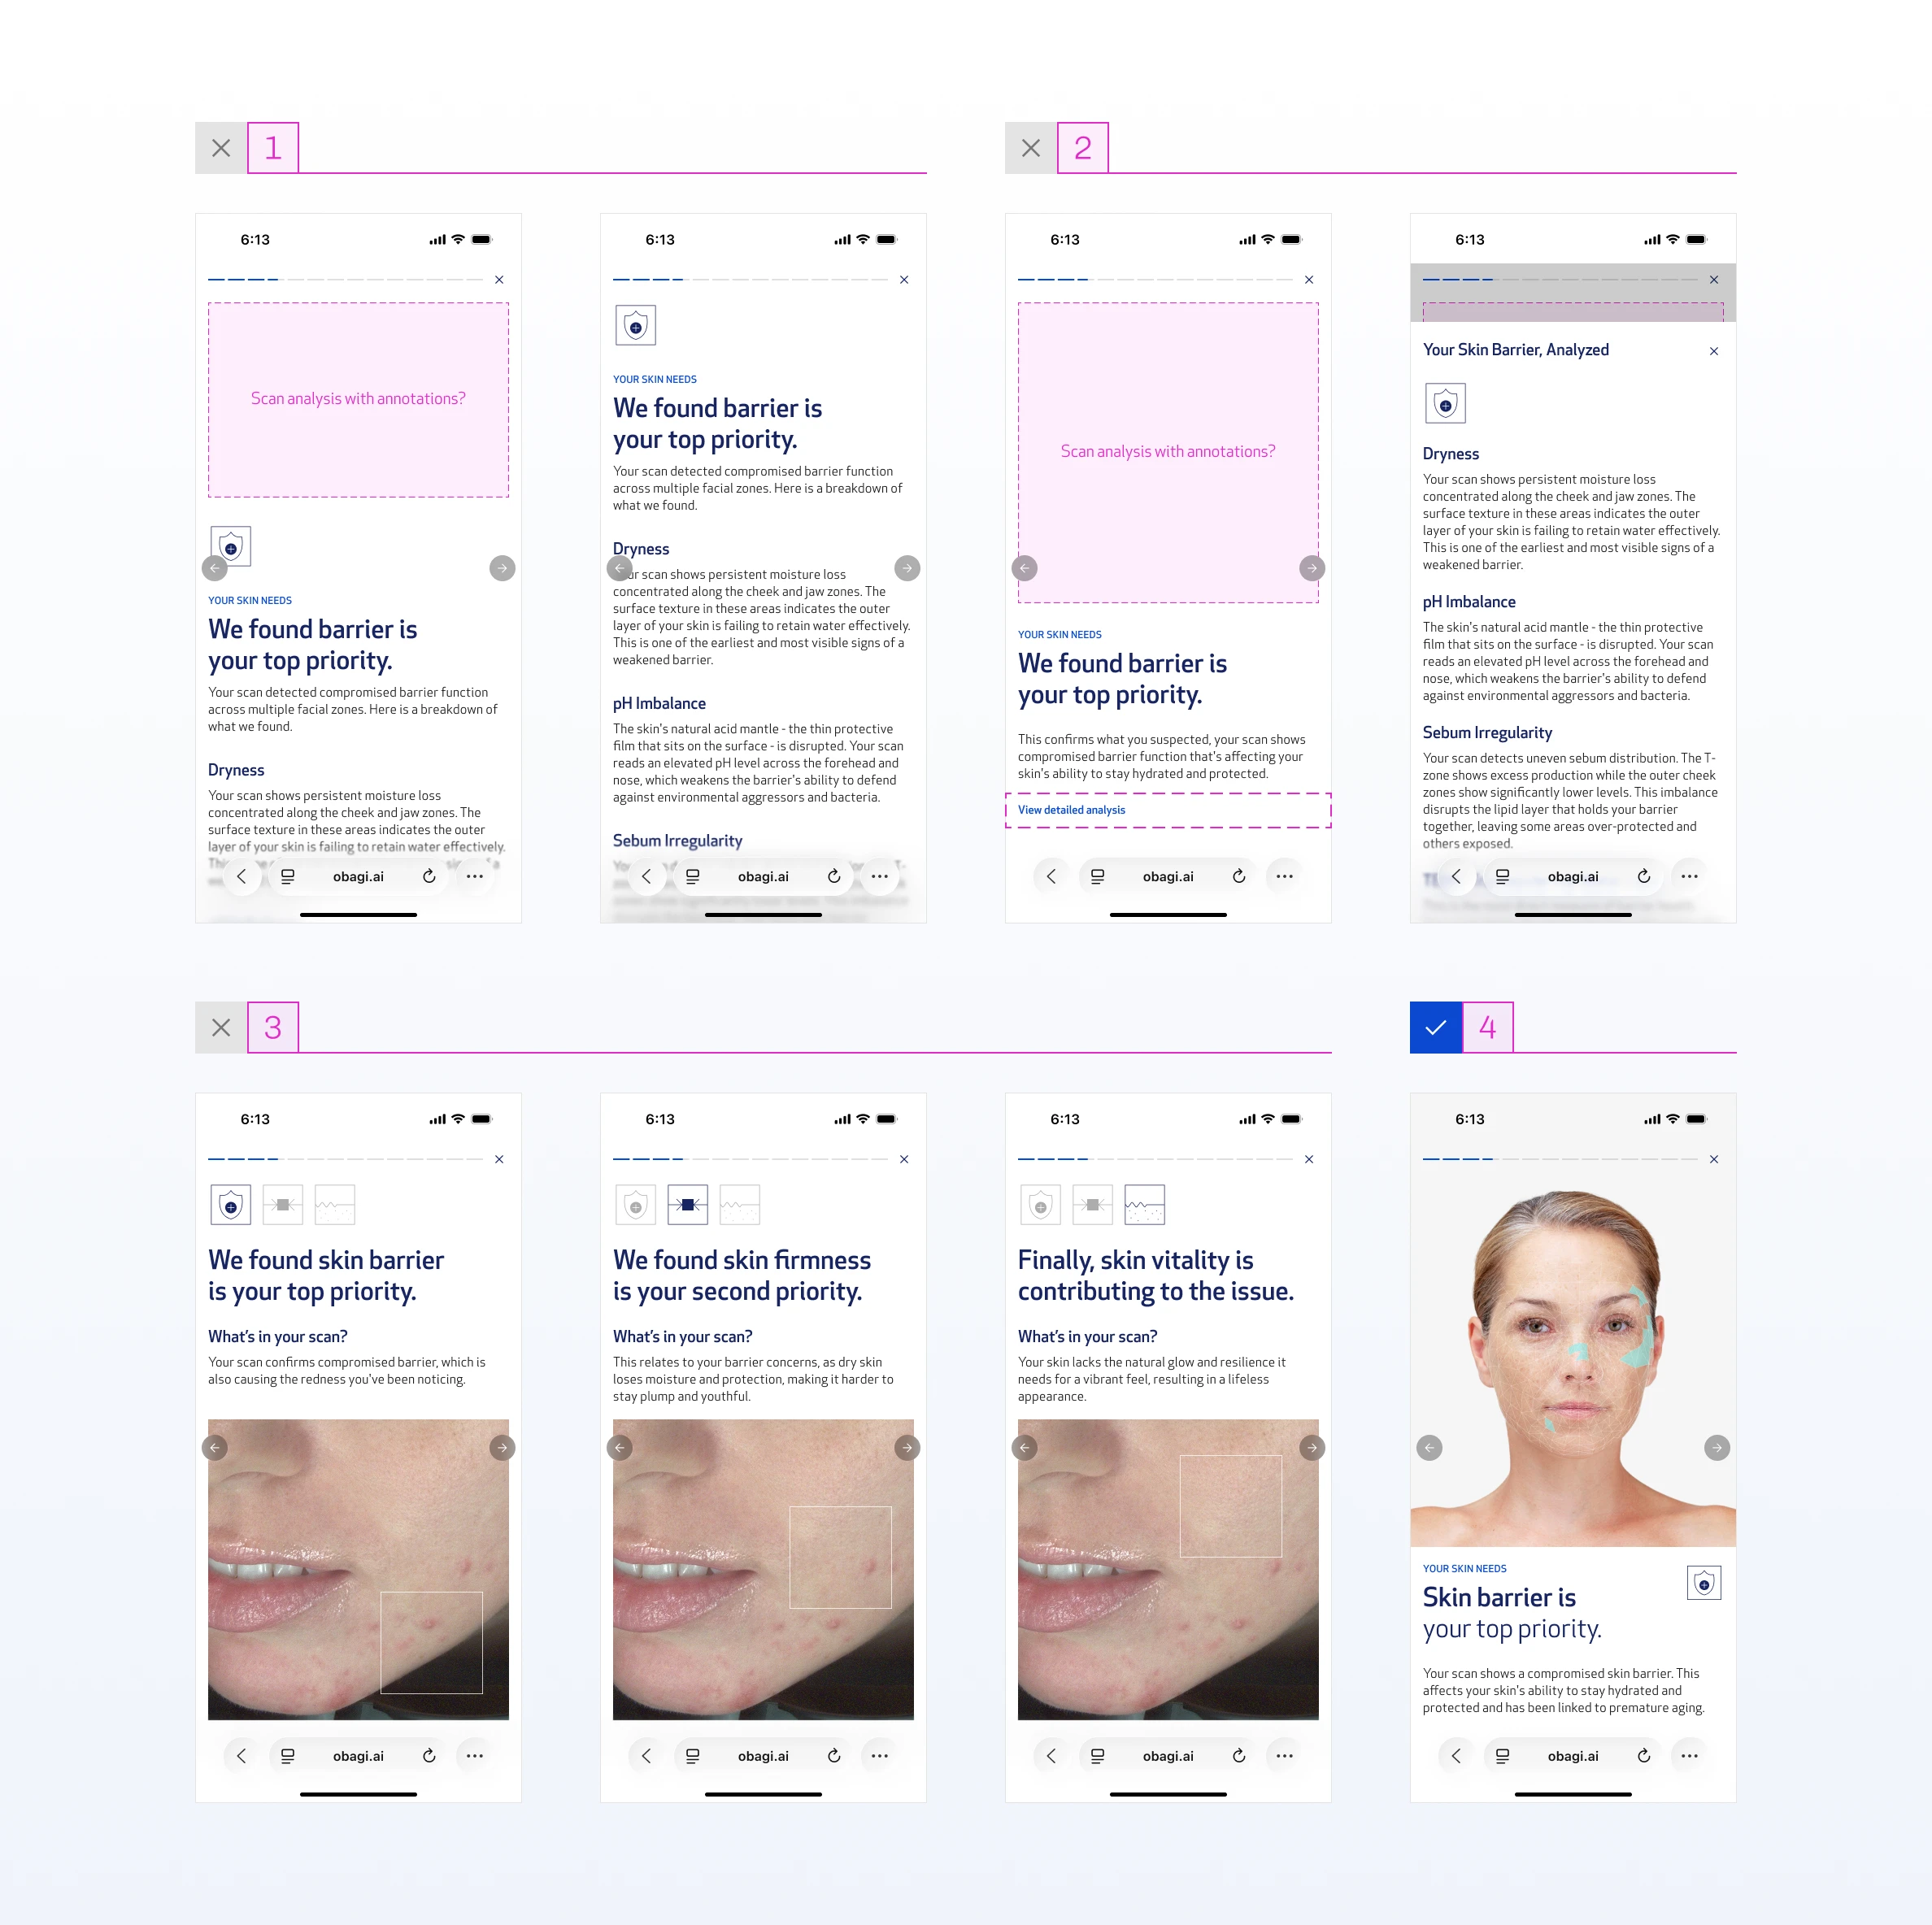
This is the validation or correction point. If the scan confirms what the user suspected, the copy validates them. If the findings differ from their stated concern, the copy gently corrects: "We understand you're concerned about skin firmness, but your scan shows a skin barrier issue." Two different story arcs, same screen structure.

The core tension: how much clinical detail is enough to build trust without breaking the story's momentum.

01

Primary clinical findings aggregated into a scrollable screen, intended to lessen the clinical weight by consolidating everything in one place. Rejected because scrolling inside a tap-only experience creates a broken interaction model.

02

Clinical detail condensed into a bottom sheet using progressive disclosure. Rejected for two reasons: it introduced a new tap behavior competing with the story mechanic, and fast tappers would skip past it entirely. The clinical depth already had a home in the PDF sent after the scan.

03

All three skin concerns connected through copy, storytelling, and visual design to communicate that the findings are linked, not isolated. Compelling in concept, but required reading to land. Too much to ask mid-story.

04

This is the final version. Consumer-focused headline, scan image, short clinical body copy. Enough to build trust in the finding without slowing the user down.
Obagi case study, image 49
Obagi case study, image 50

Product Connection Screen

Product connection screen

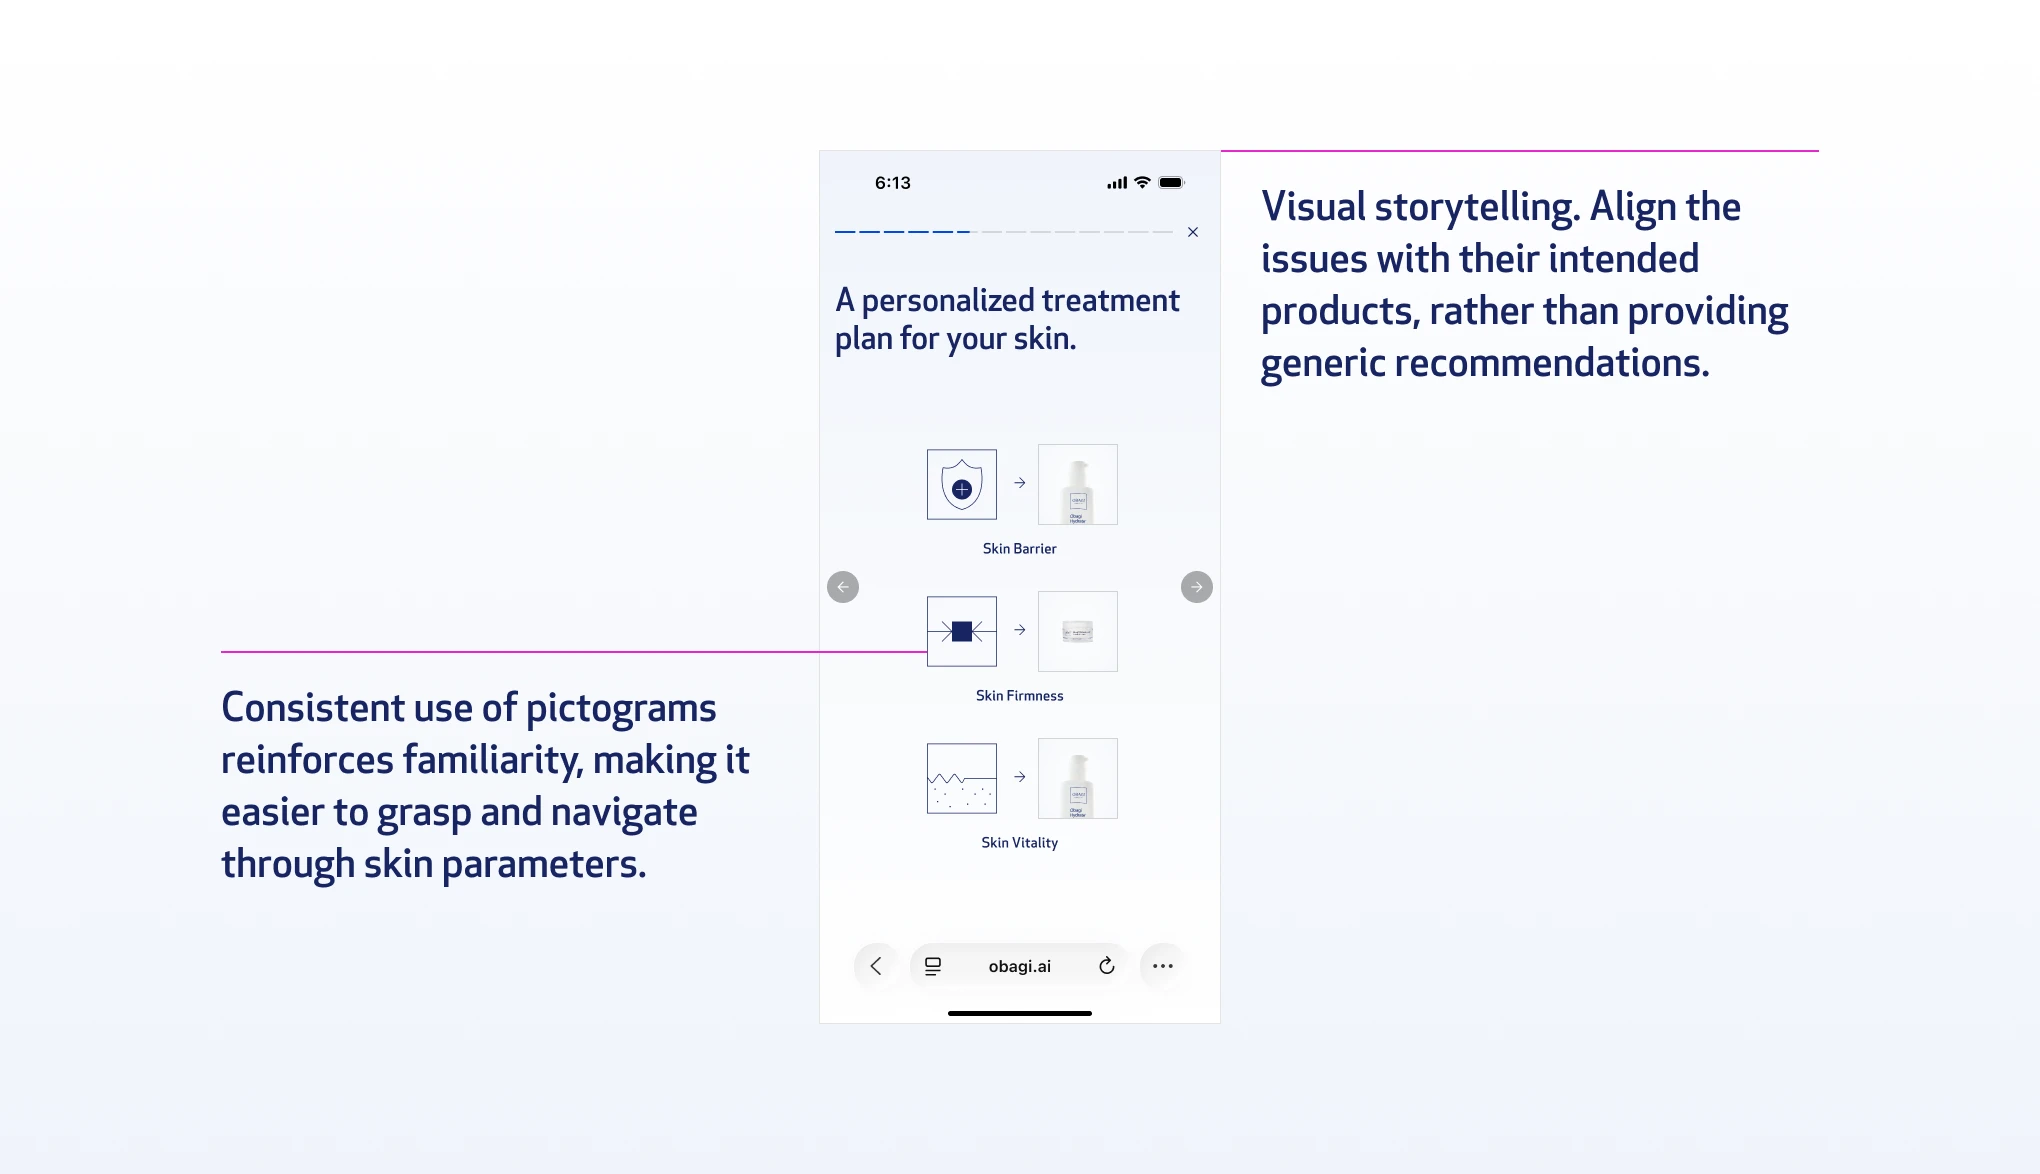
Animation showing the three concerns with arrows pointing to the products that address each one. Visual, scannable, no clinical language needed.
Obagi case study, image 51
Obagi case study, image 52

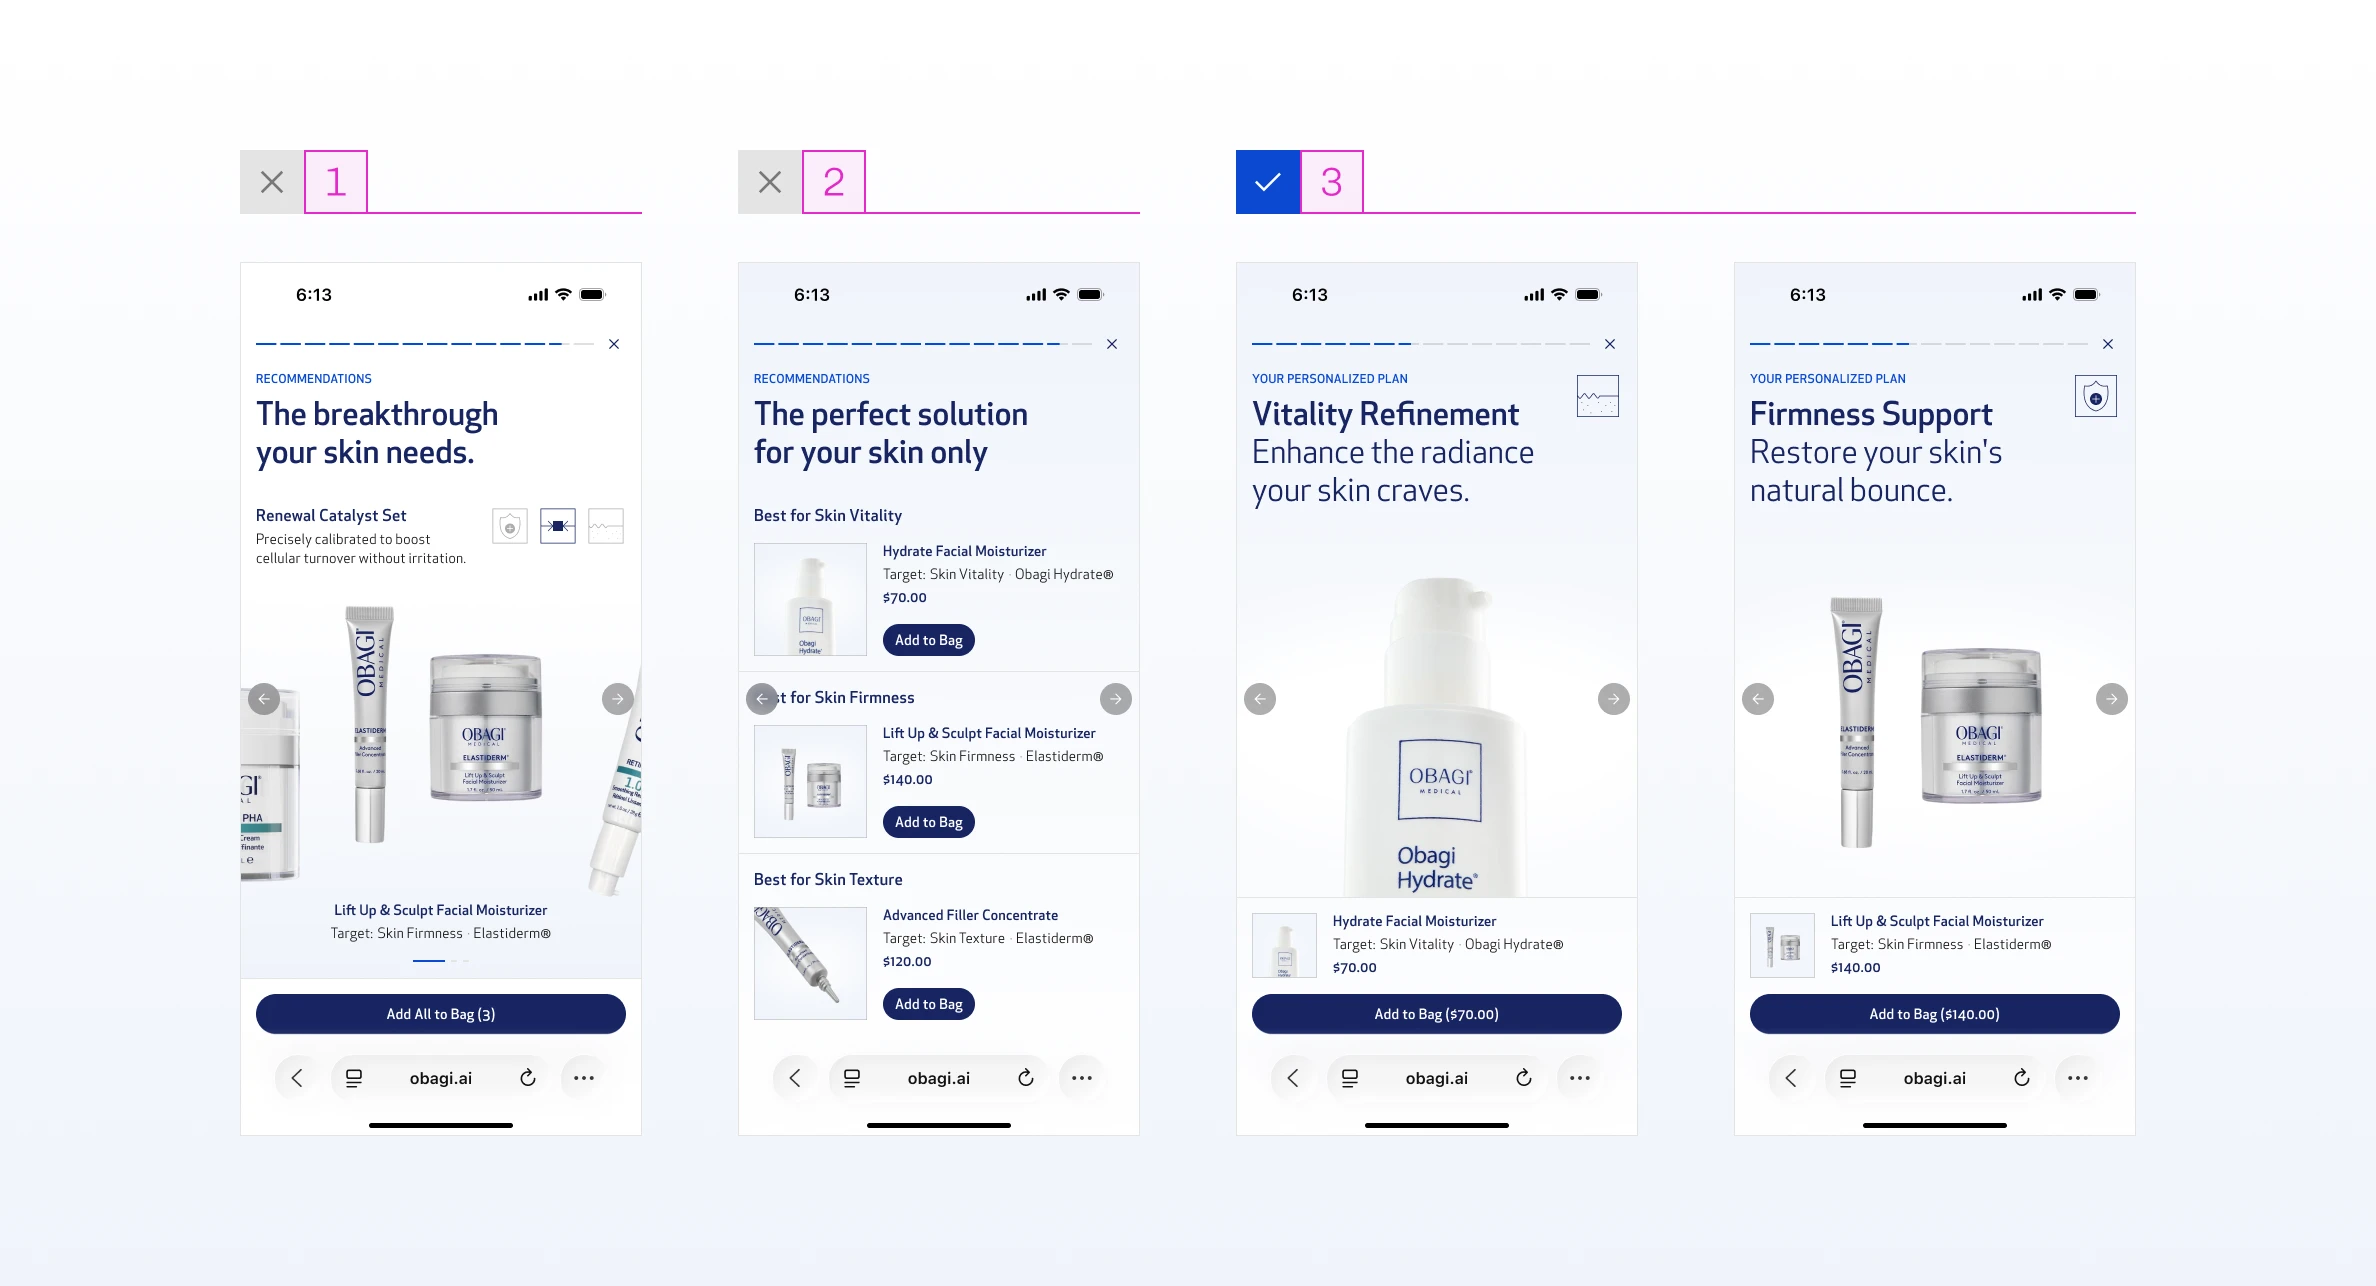
Product Showcase Screens

Product showcase

The product itself, price, and one effectiveness number. Clean. Not a product detail page. The core tension: how much to show without overwhelming, while still converting.

01

Forced bundle, all products packaged together with no individual choice. Rejected because accommodating all products in one screen reintroduced information overload, and removing user control felt more pushy than consultative.

02

All products listed on one screen, individually selectable. User control was there, but the screen became dense and story momentum stalled.

03

This is the final version. One product per screen, full-bleed image, the skin concern it targets, price, and a single "Add to Bag" button. One product, one screen, one decision. An aggregated bundle screen follows at the end for users ready to add everything in one tap.
Obagi case study, image 53
Obagi case study, image 54

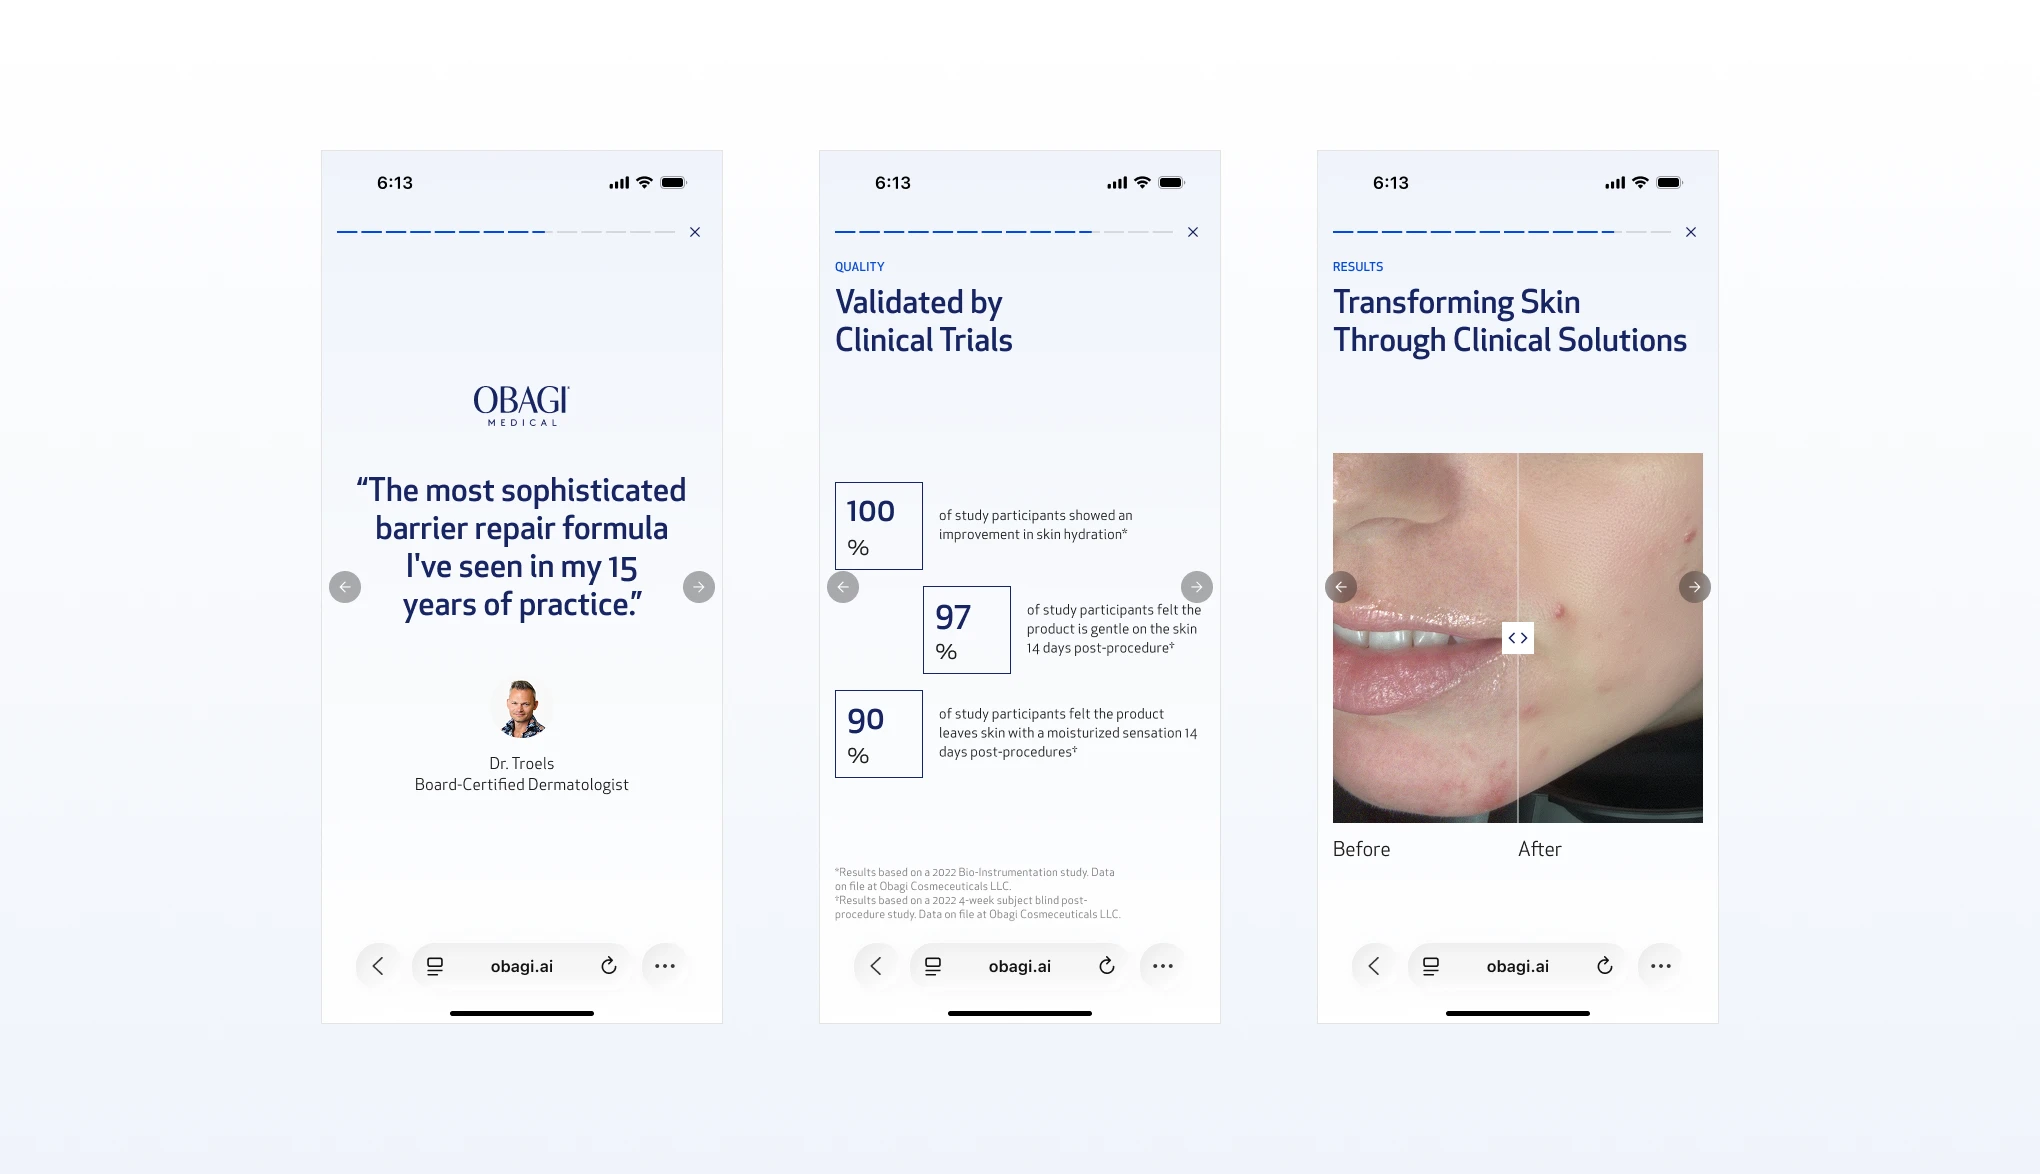
Social Proof Screens

Social proof trilogy

Dermatologist quote, before & after, clinical data. Three separate screens, each focused on one trust signal rather than stacking them.
Obagi case study, image 55
Obagi case study, image 56

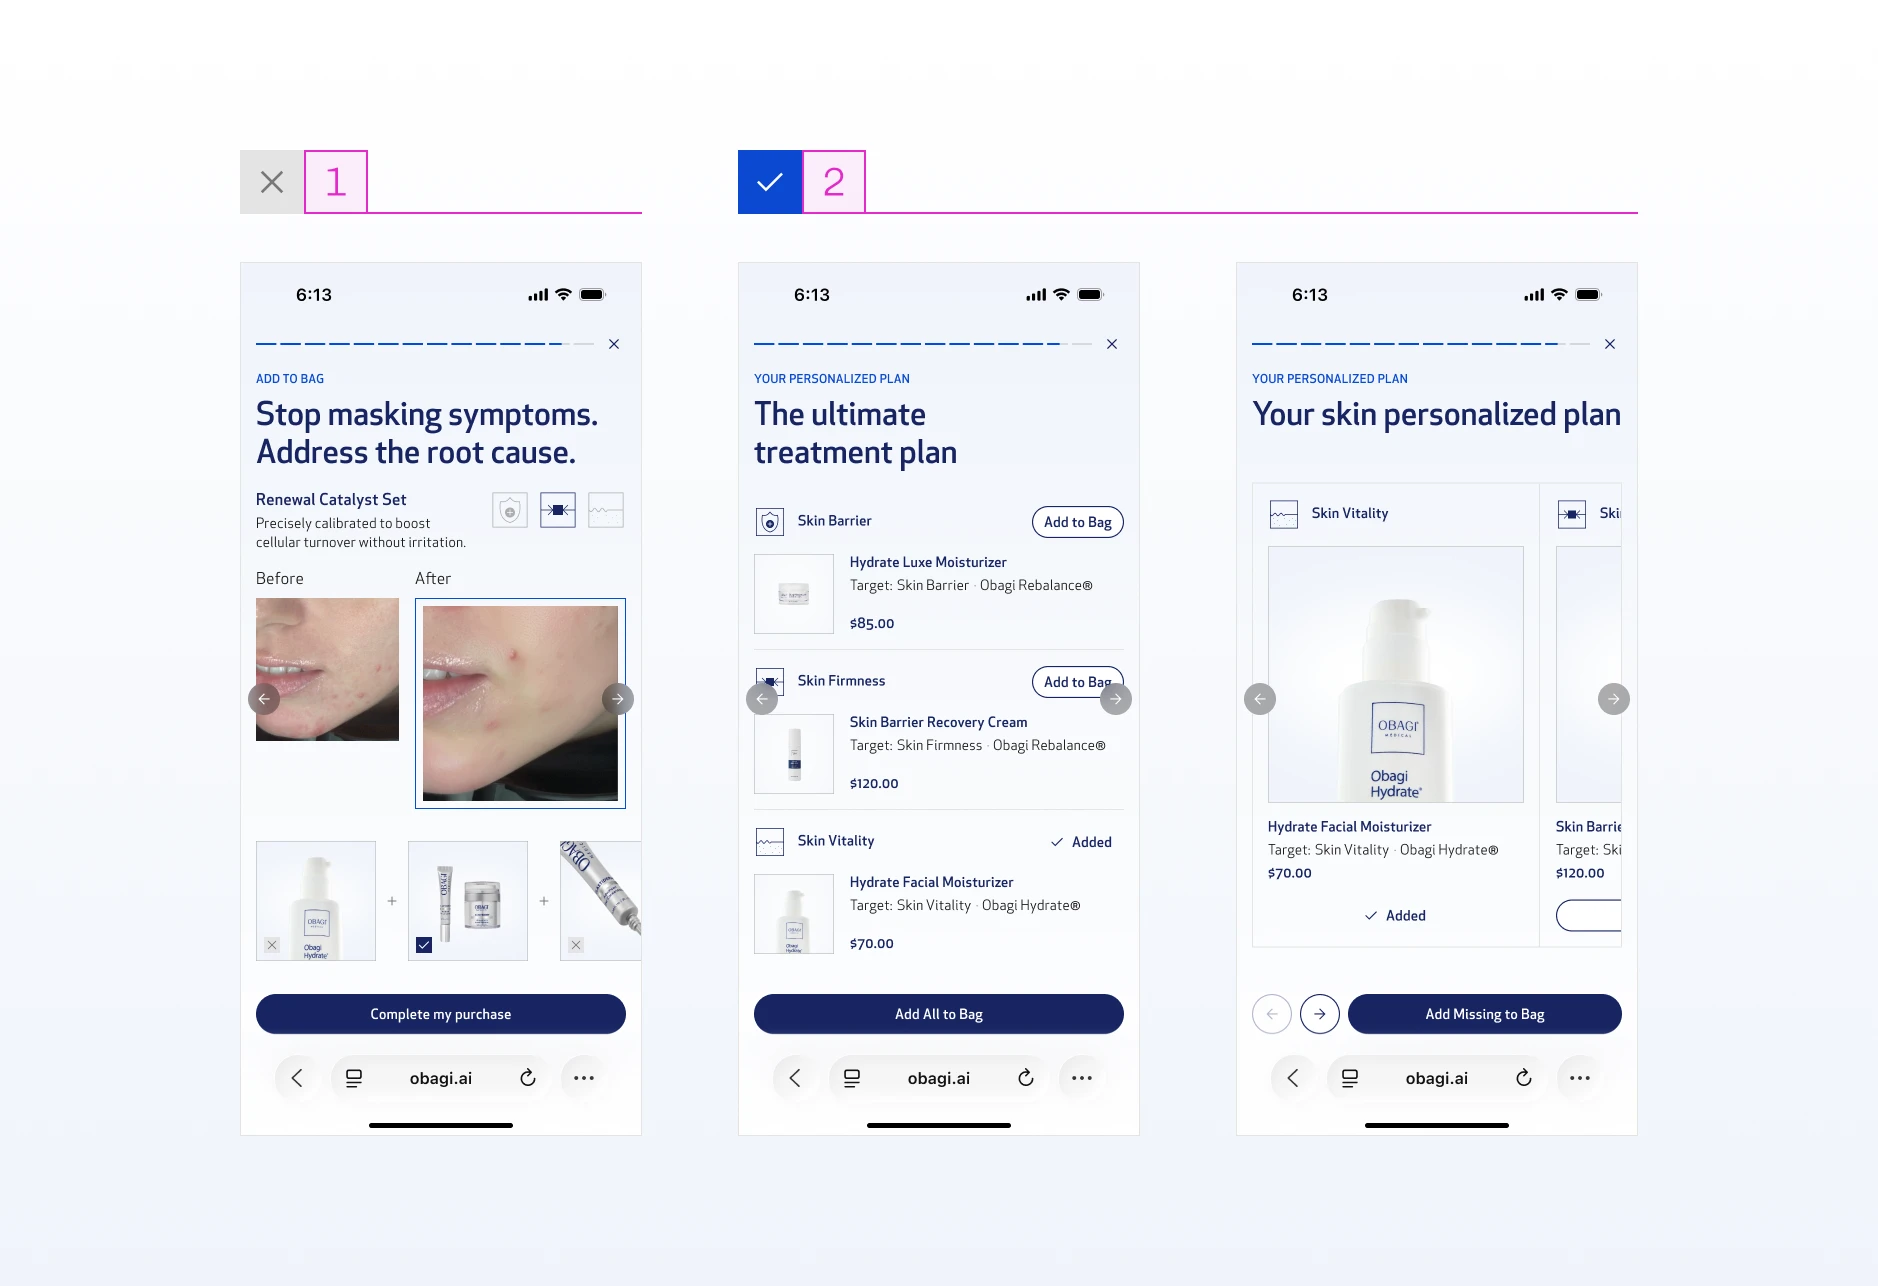
Aggregate & Add to Bag Screens

Aggregate and add to bag

All recommended products listed, individual "Add to Bag" buttons, and an "Add All" option for the user who's ready to commit. The core tension: what to pair with the add to bag action to increase conversion without pulling focus from it.

01

Before and after image paired with the product list. Social proof right before the purchase decision should reduce hesitation, but the visual weight of the before and after pulled attention away from the products and the CTA entirely.

02

Products only, as a vertical list or a carousel. Both are clean and focused with nothing competing with the add to bag action. Both versions kept and marked for A/B testing in a later phase.
Obagi case study, image 57
Obagi case study, image 58

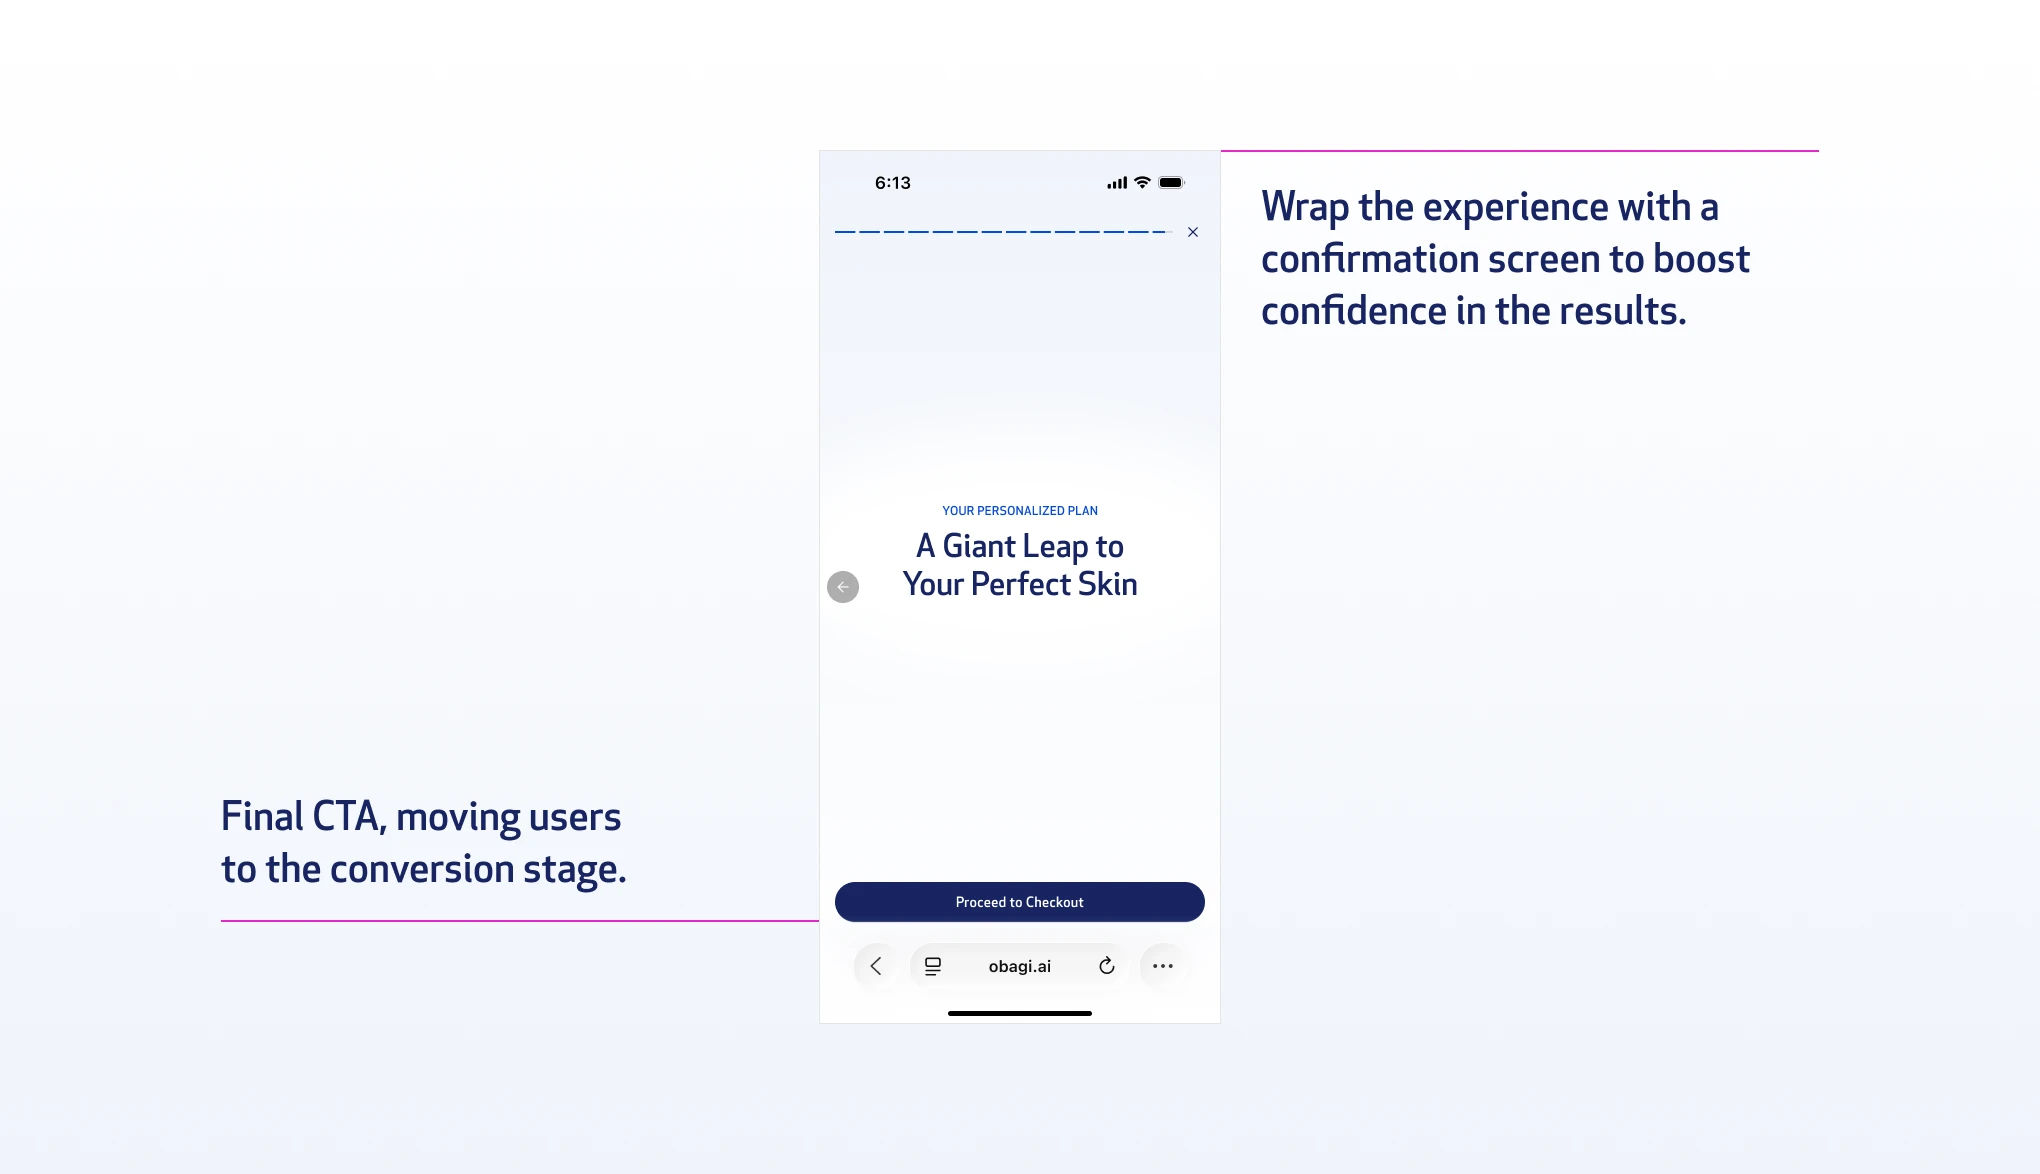
Confirmation Screen

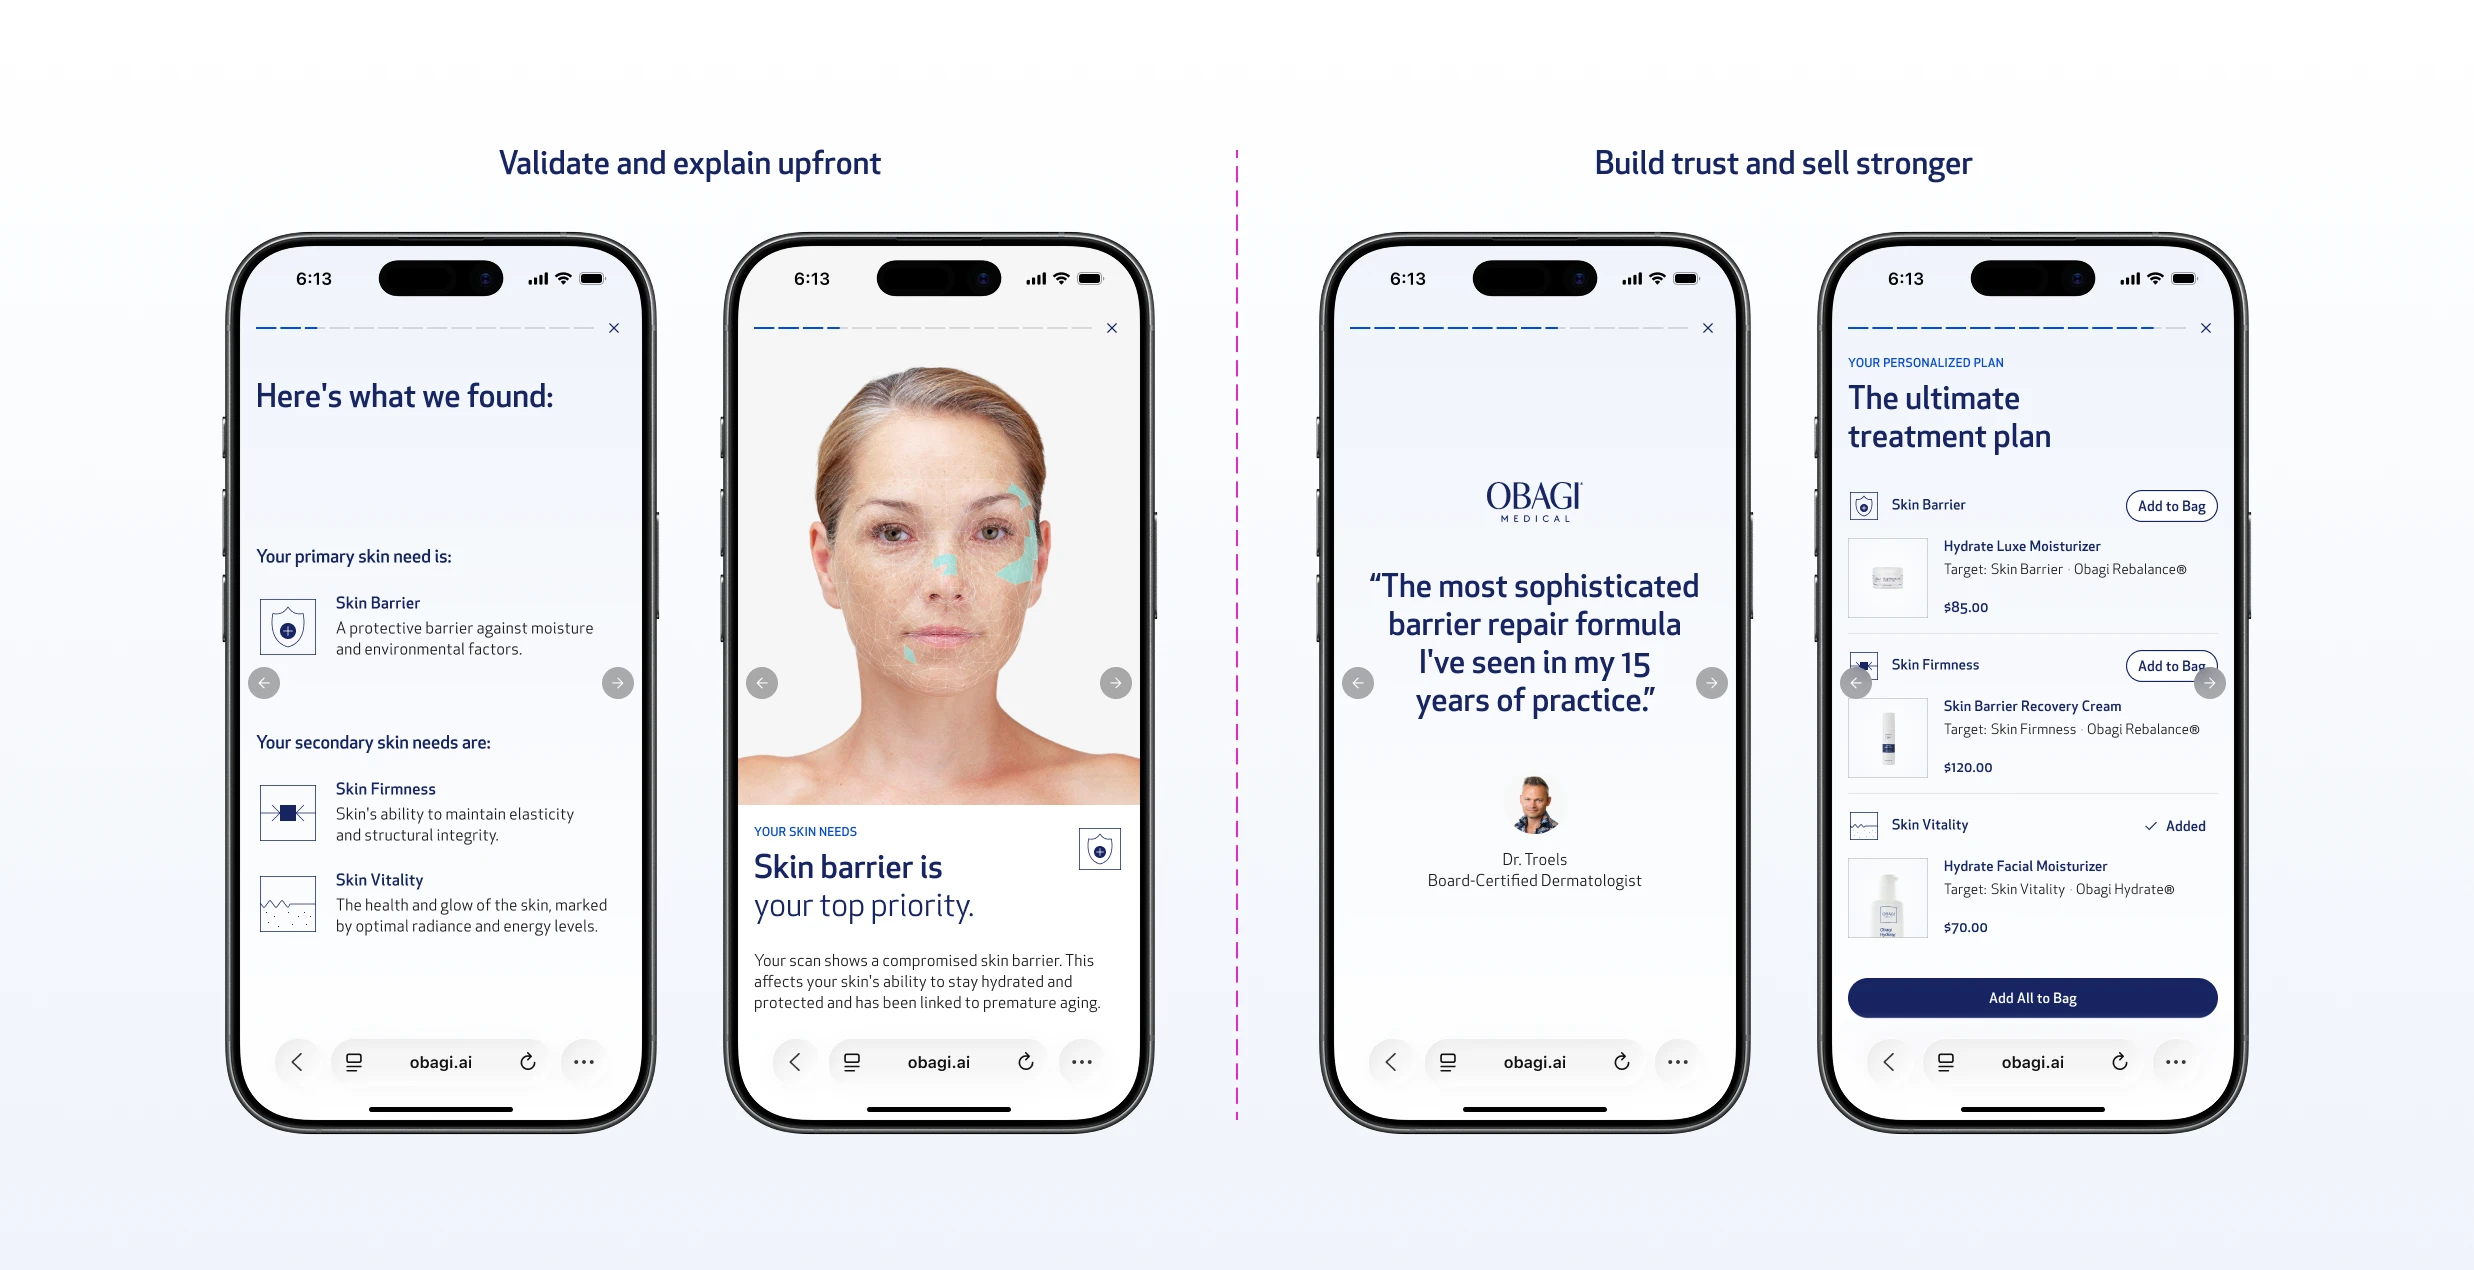
Confirmation screen

A closing moment affirming the decision. Sends the user to checkout with confidence rather than hesitation.
Obagi case study, image 59
Obagi case study, image 60

The Sequence Logic

The sequence logic was intentional: validate before selling, explain before recommending, build trust before asking for the transaction. Every screen has one job. Nothing competes.

Storytelling

The story only works if it speaks to the user, not at them.

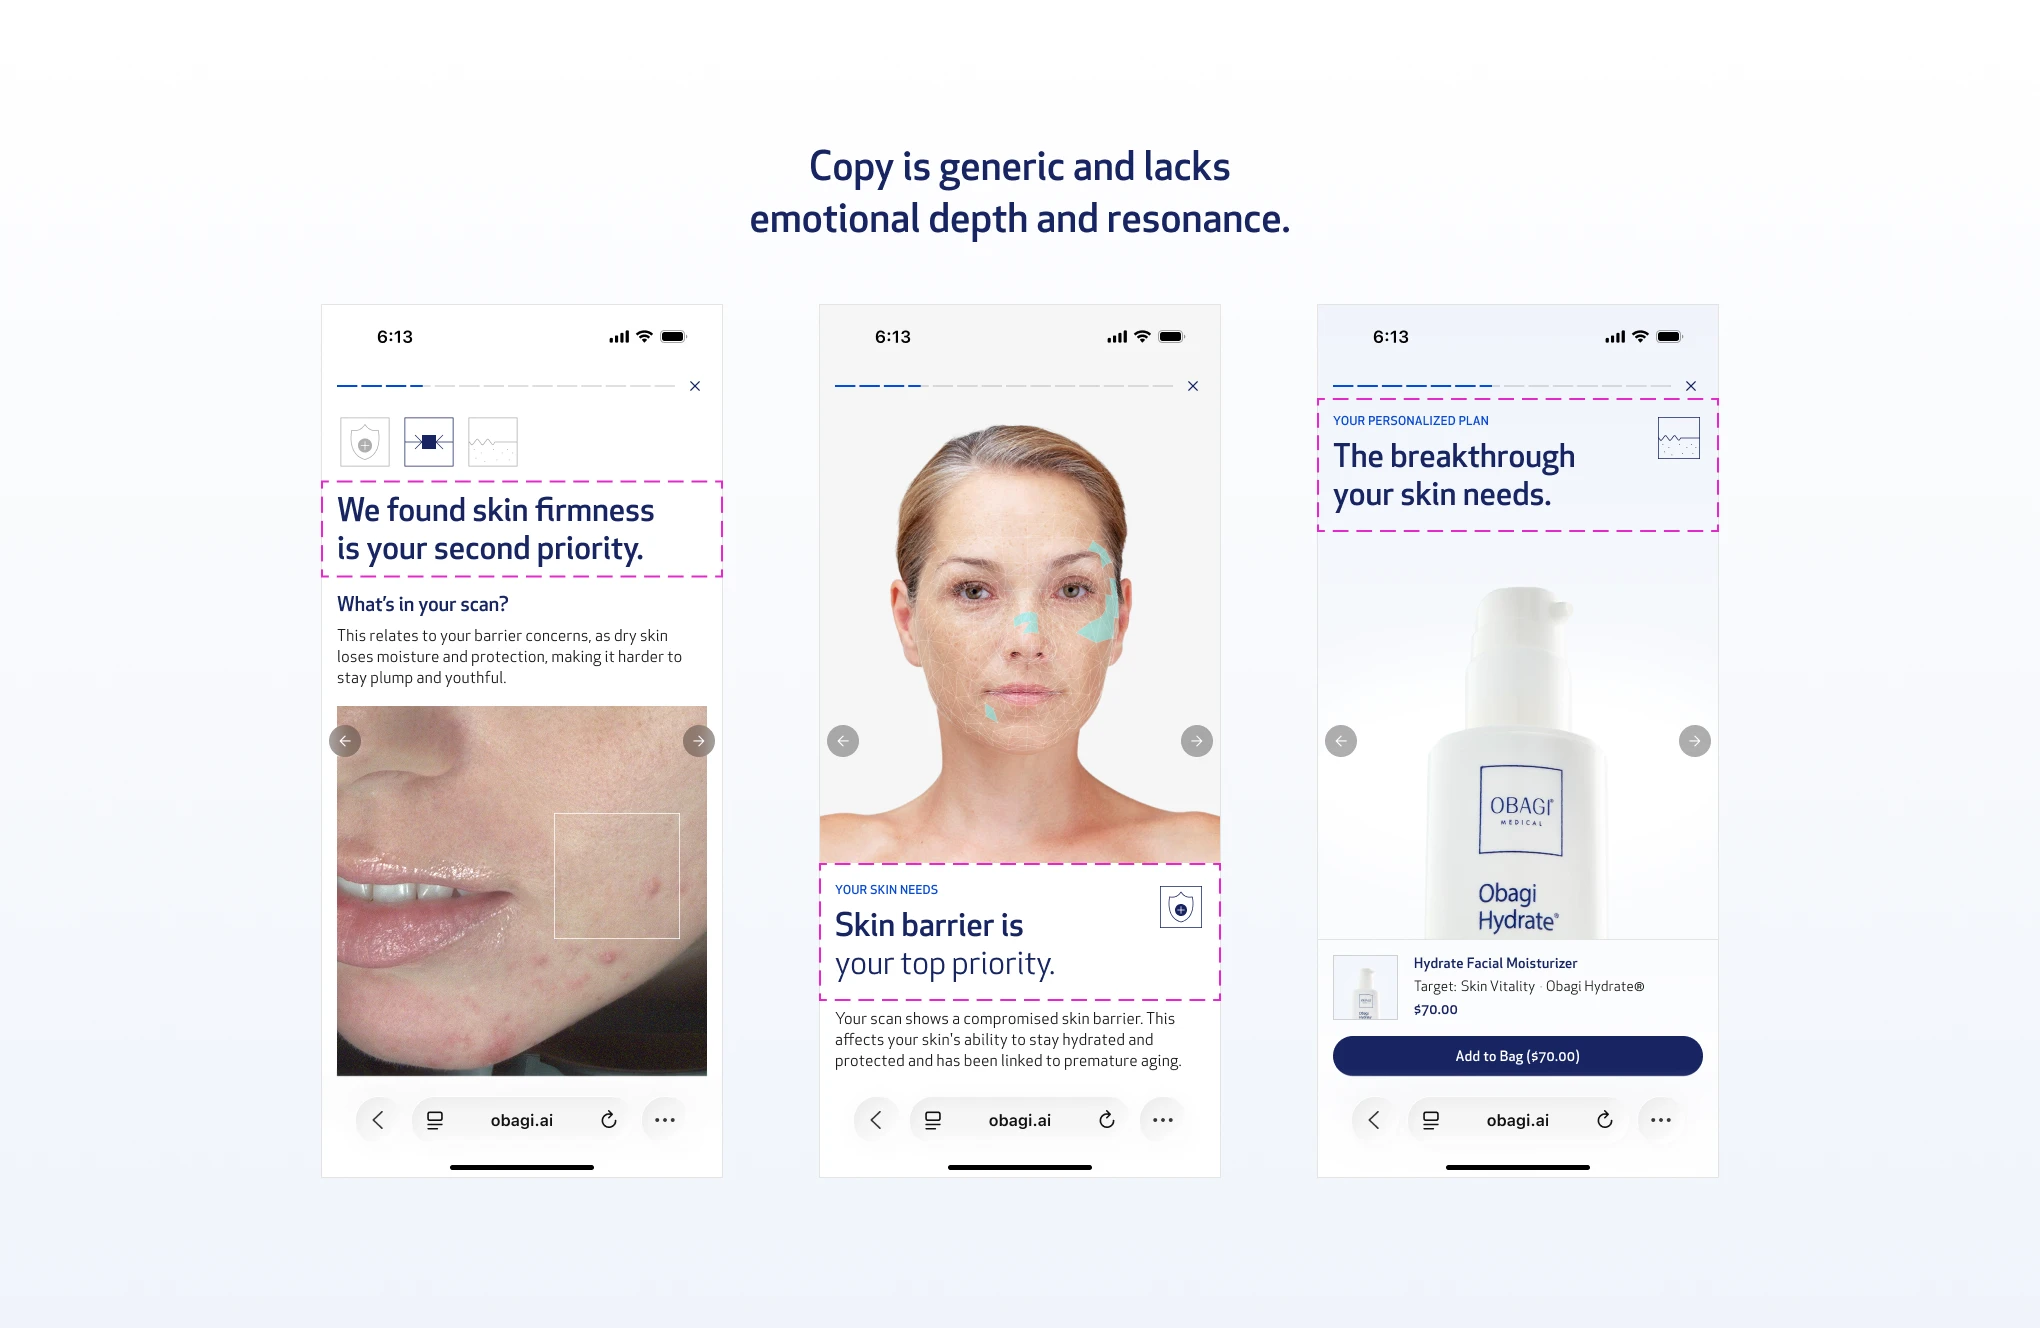
The first iteration of the story format had copy, but it was direct and clinical. Just the sequence: here is what we found, here is the product. No acknowledgment of what the user came in believing, no emotional thread connecting the diagnosis to the recommendation. The team liked the concept, but the internal crit was clear: it felt like a showcase, not a story. There was no emotional bond between the user and the experience.
Obagi case study, image 61
Obagi case study, image 62

Iterations First Copy

That feedback sent me back to the quiz.

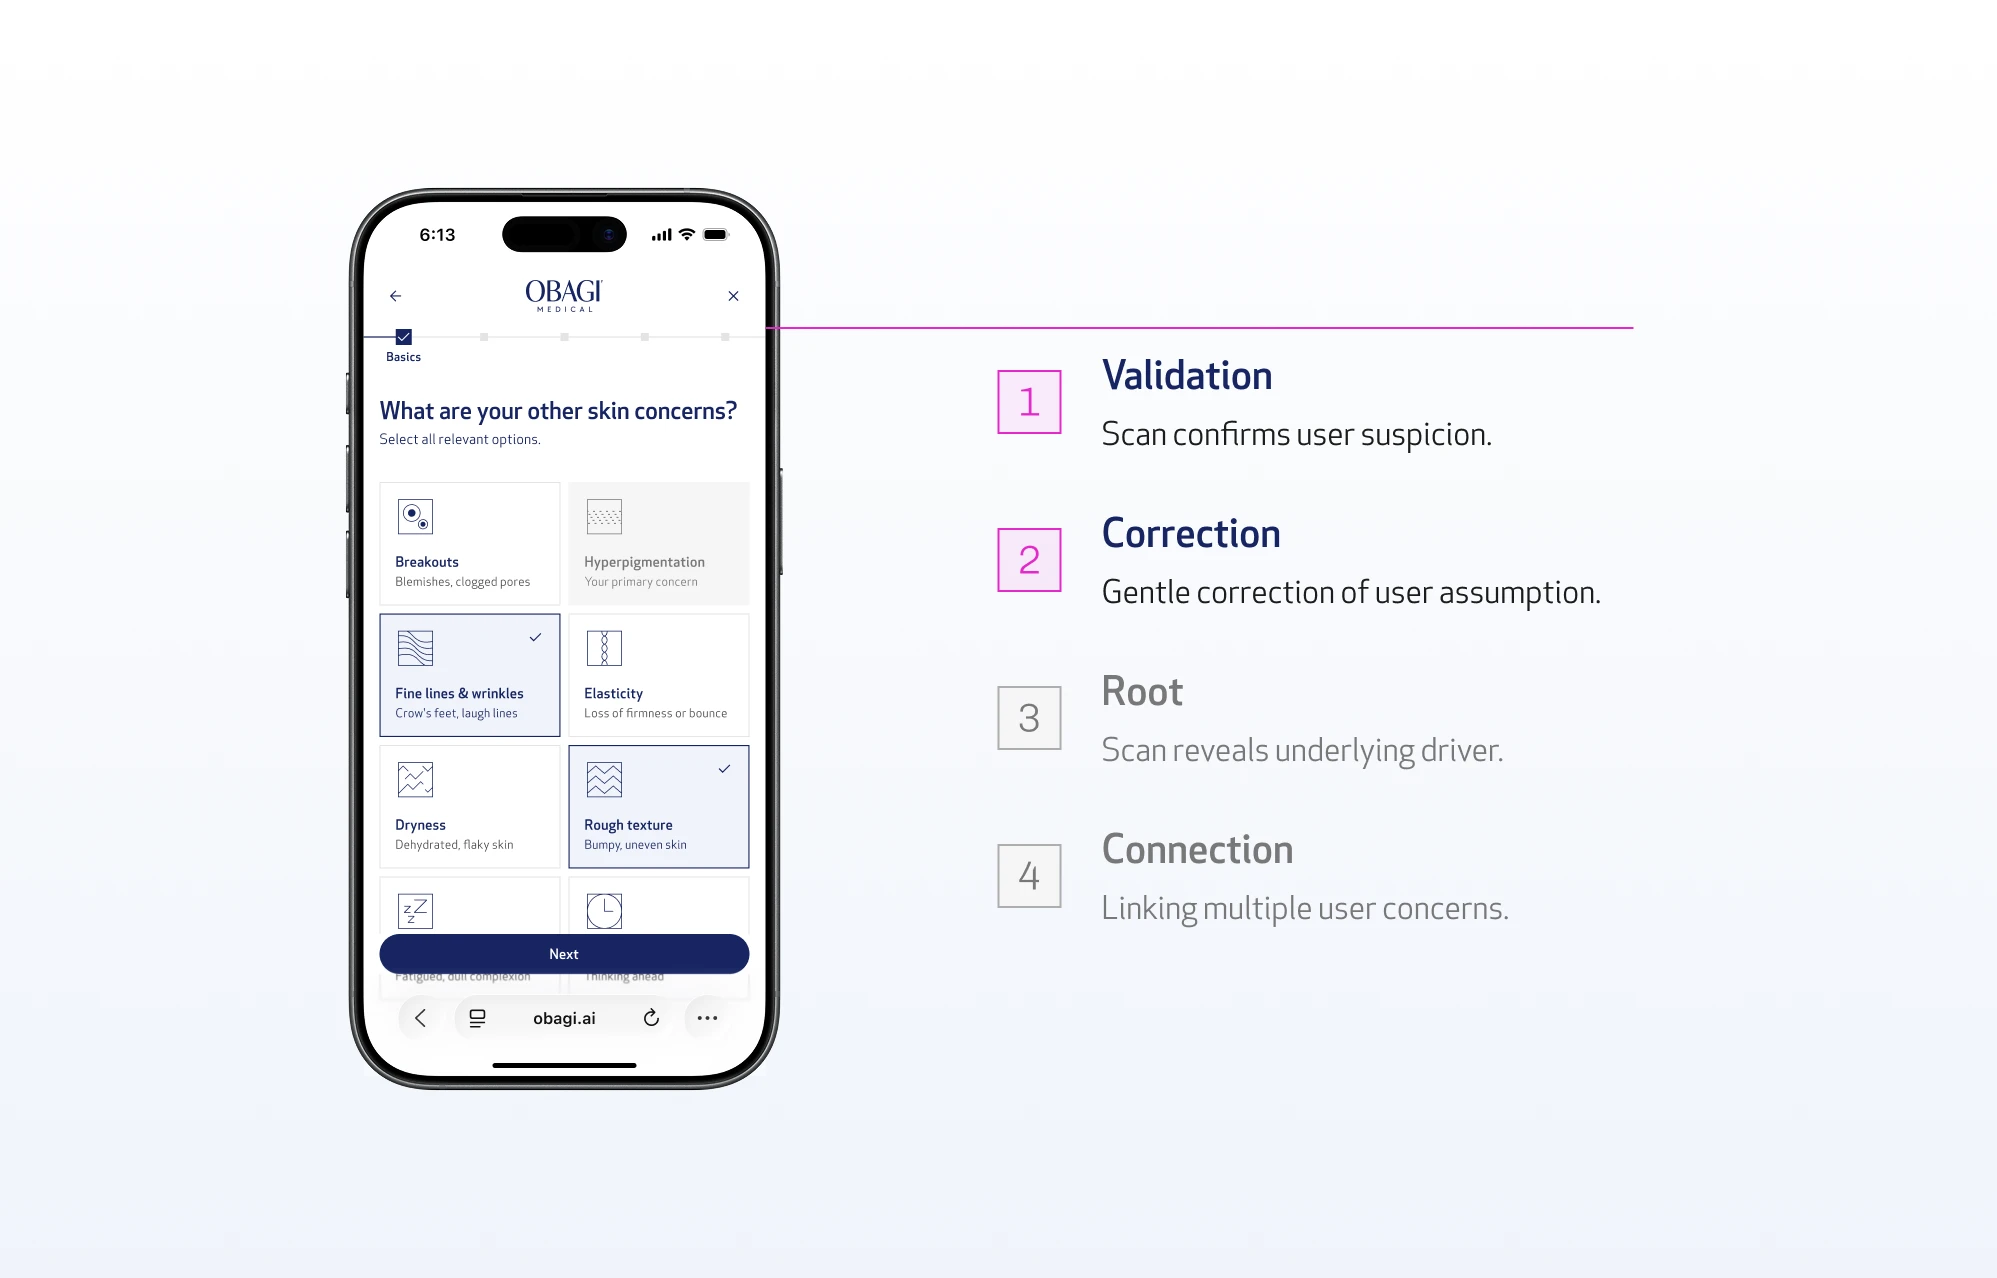
Inside the assessment, users select their stated skin concern, what they already believe is their problem. That's a significant signal. A user who selects "skin barrier" is telling you something about how they see themselves and what they came here to fix. When the scan runs and the findings come back, two things can happen: the scan confirms what they suspected, or it finds something different.
Obagi case study, image 63
Obagi case study, image 64

Quiz to Narrative

If you ignore that distinction and just present the findings as facts, you create friction. The user arrived with a belief. The screen contradicts it without acknowledgment. That gap between what they think and what the scan found is exactly where trust breaks down.

Think about a real dermatologist visit. You walk in with a stated concern. The doctor listens, runs their assessment, and then talks you through what they found - whether it confirms what you suspected or surfaces something new. They never just hand you a diagnosis and walk out. The conversation is part of the experience. That's what the copy needed to replicate: a system that feels like it's talking to you, not at you.

This also directly mirrors the authority that Obagi embodies as a brand. They are a clinically backed, dermatologist-trusted brand. The story format needed to reflect that same standard: knowledgeable, consultative, and personal.
Obagi case study, image 65
Obagi case study, image 66

New Copy Arcs Applied

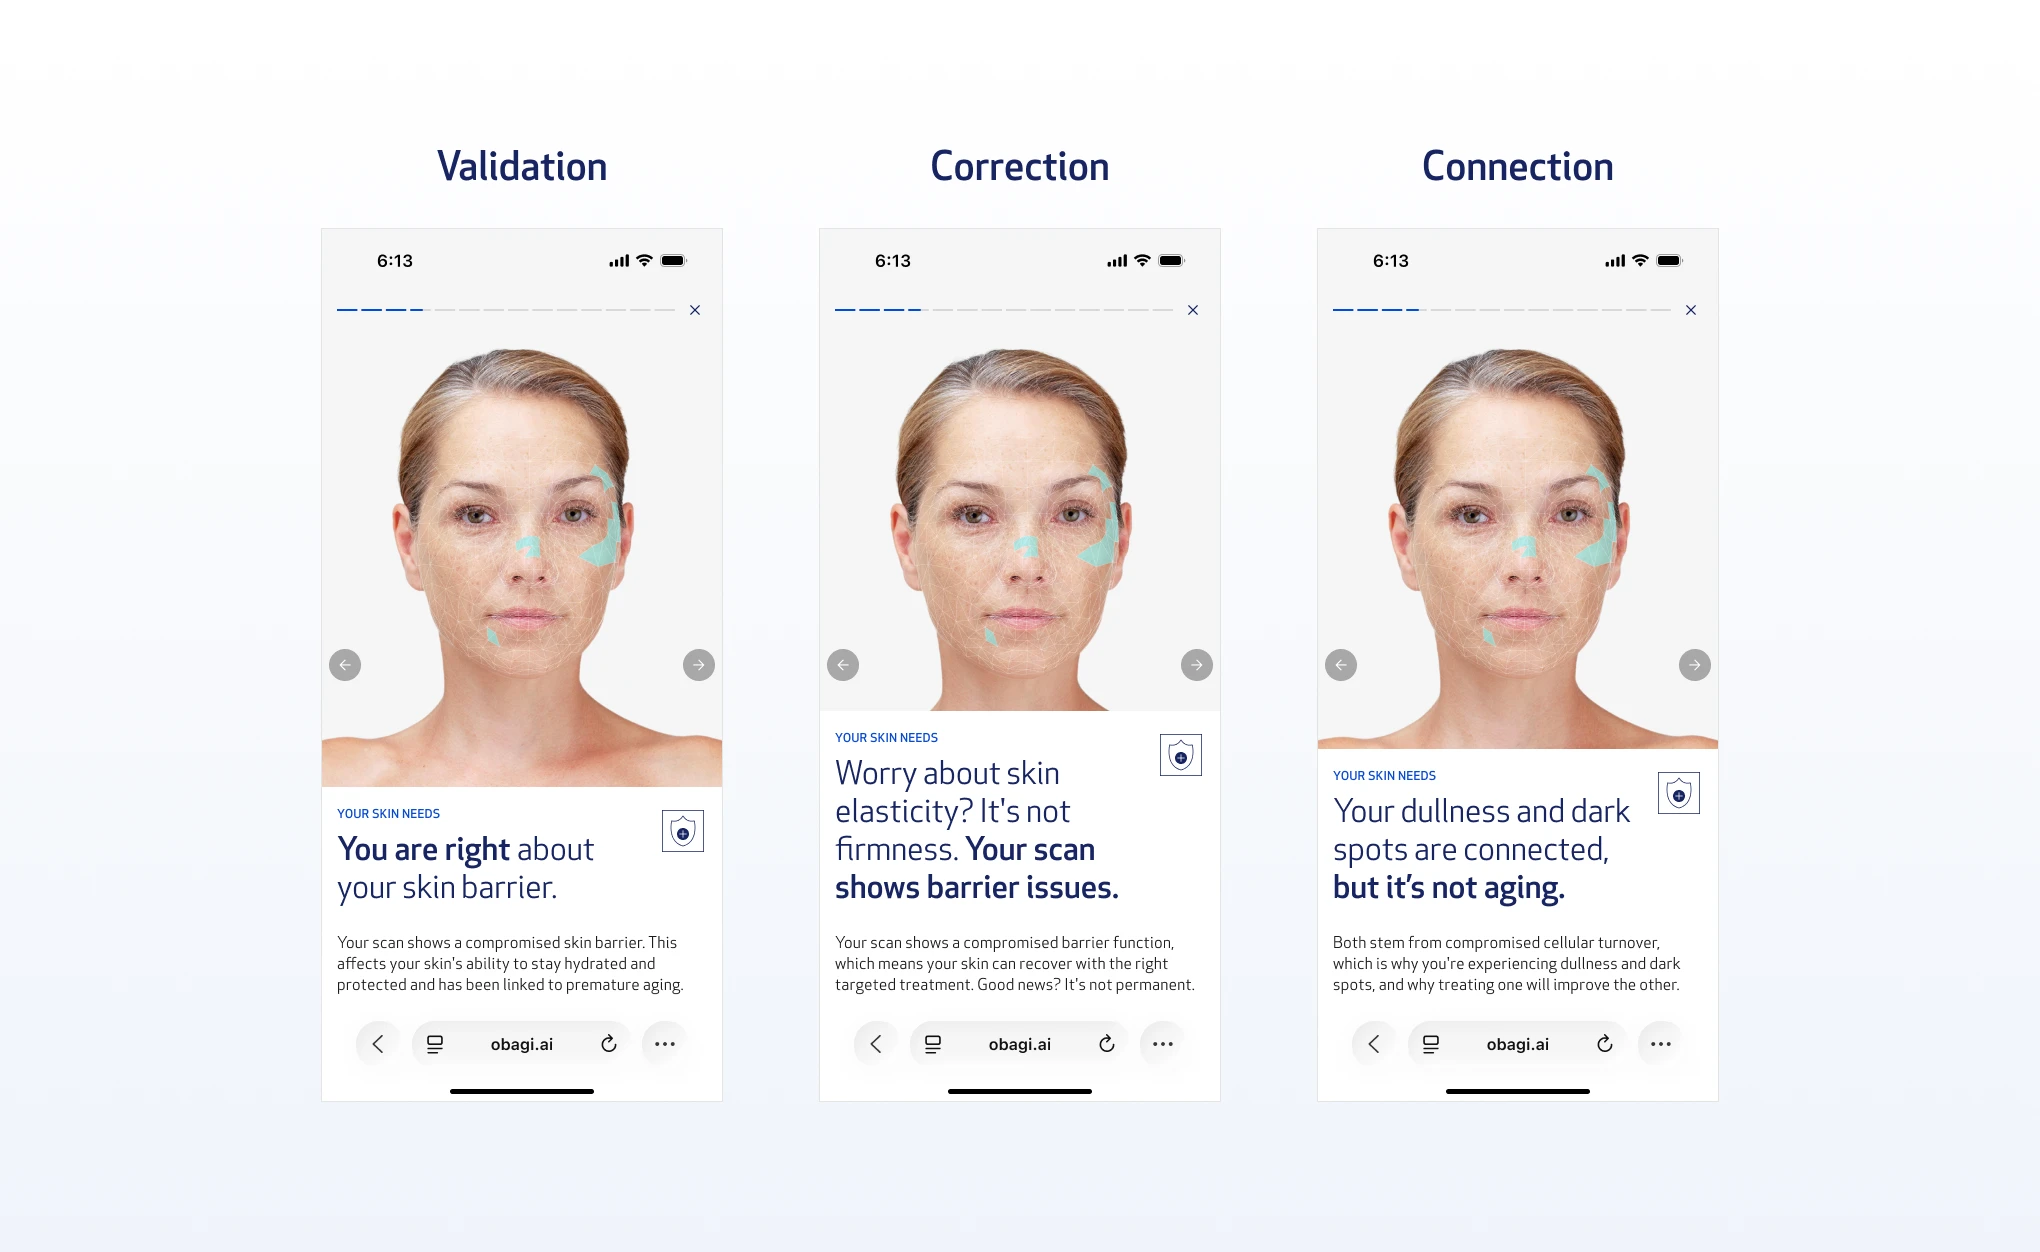
The solution (called Concern-Centered Narrative Assembly) was two story arcs (selected from four) with identical screen structures but different copy:

Validation flow

When the scan confirms the user's stated concern, the copy acknowledges it. "Your instinct was right. Here's what we found." The user feels seen, not sold to.

Correction flow

When the scan finds something different, the copy meets them where they are before redirecting. It acknowledges what they care about first, then introduces the finding as new information rather than a contradiction. "We know you're focused on skin firmness. Your scan also shows a skin barrier issue that's worth addressing."

The tone never tells the user they are wrong. It treats the mismatch as a discovery, not a correction. The brand voice came from Obagi's copy team, but the structural logic (acknowledge first, redirect second) came from understanding where the emotional friction lived.

This was the detail that turned a clinical showcase into a conversation.

Decision

The vertical scroll stayed - because two users have two different needs.

The story format solved the engagement problem. But it created a new one.

Users coming from other skincare brands expect a report. If they've used Cetaphil's skin assessment or any competitor tool, they're conditioned to a vertical scroll. Replacing the report entirely with a story format would confuse them. It would also sacrifice the vertical real estate that still works for certain users, the ones who want to read, who trust clinical detail, who want to understand before they buy.

The solution was to keep both.
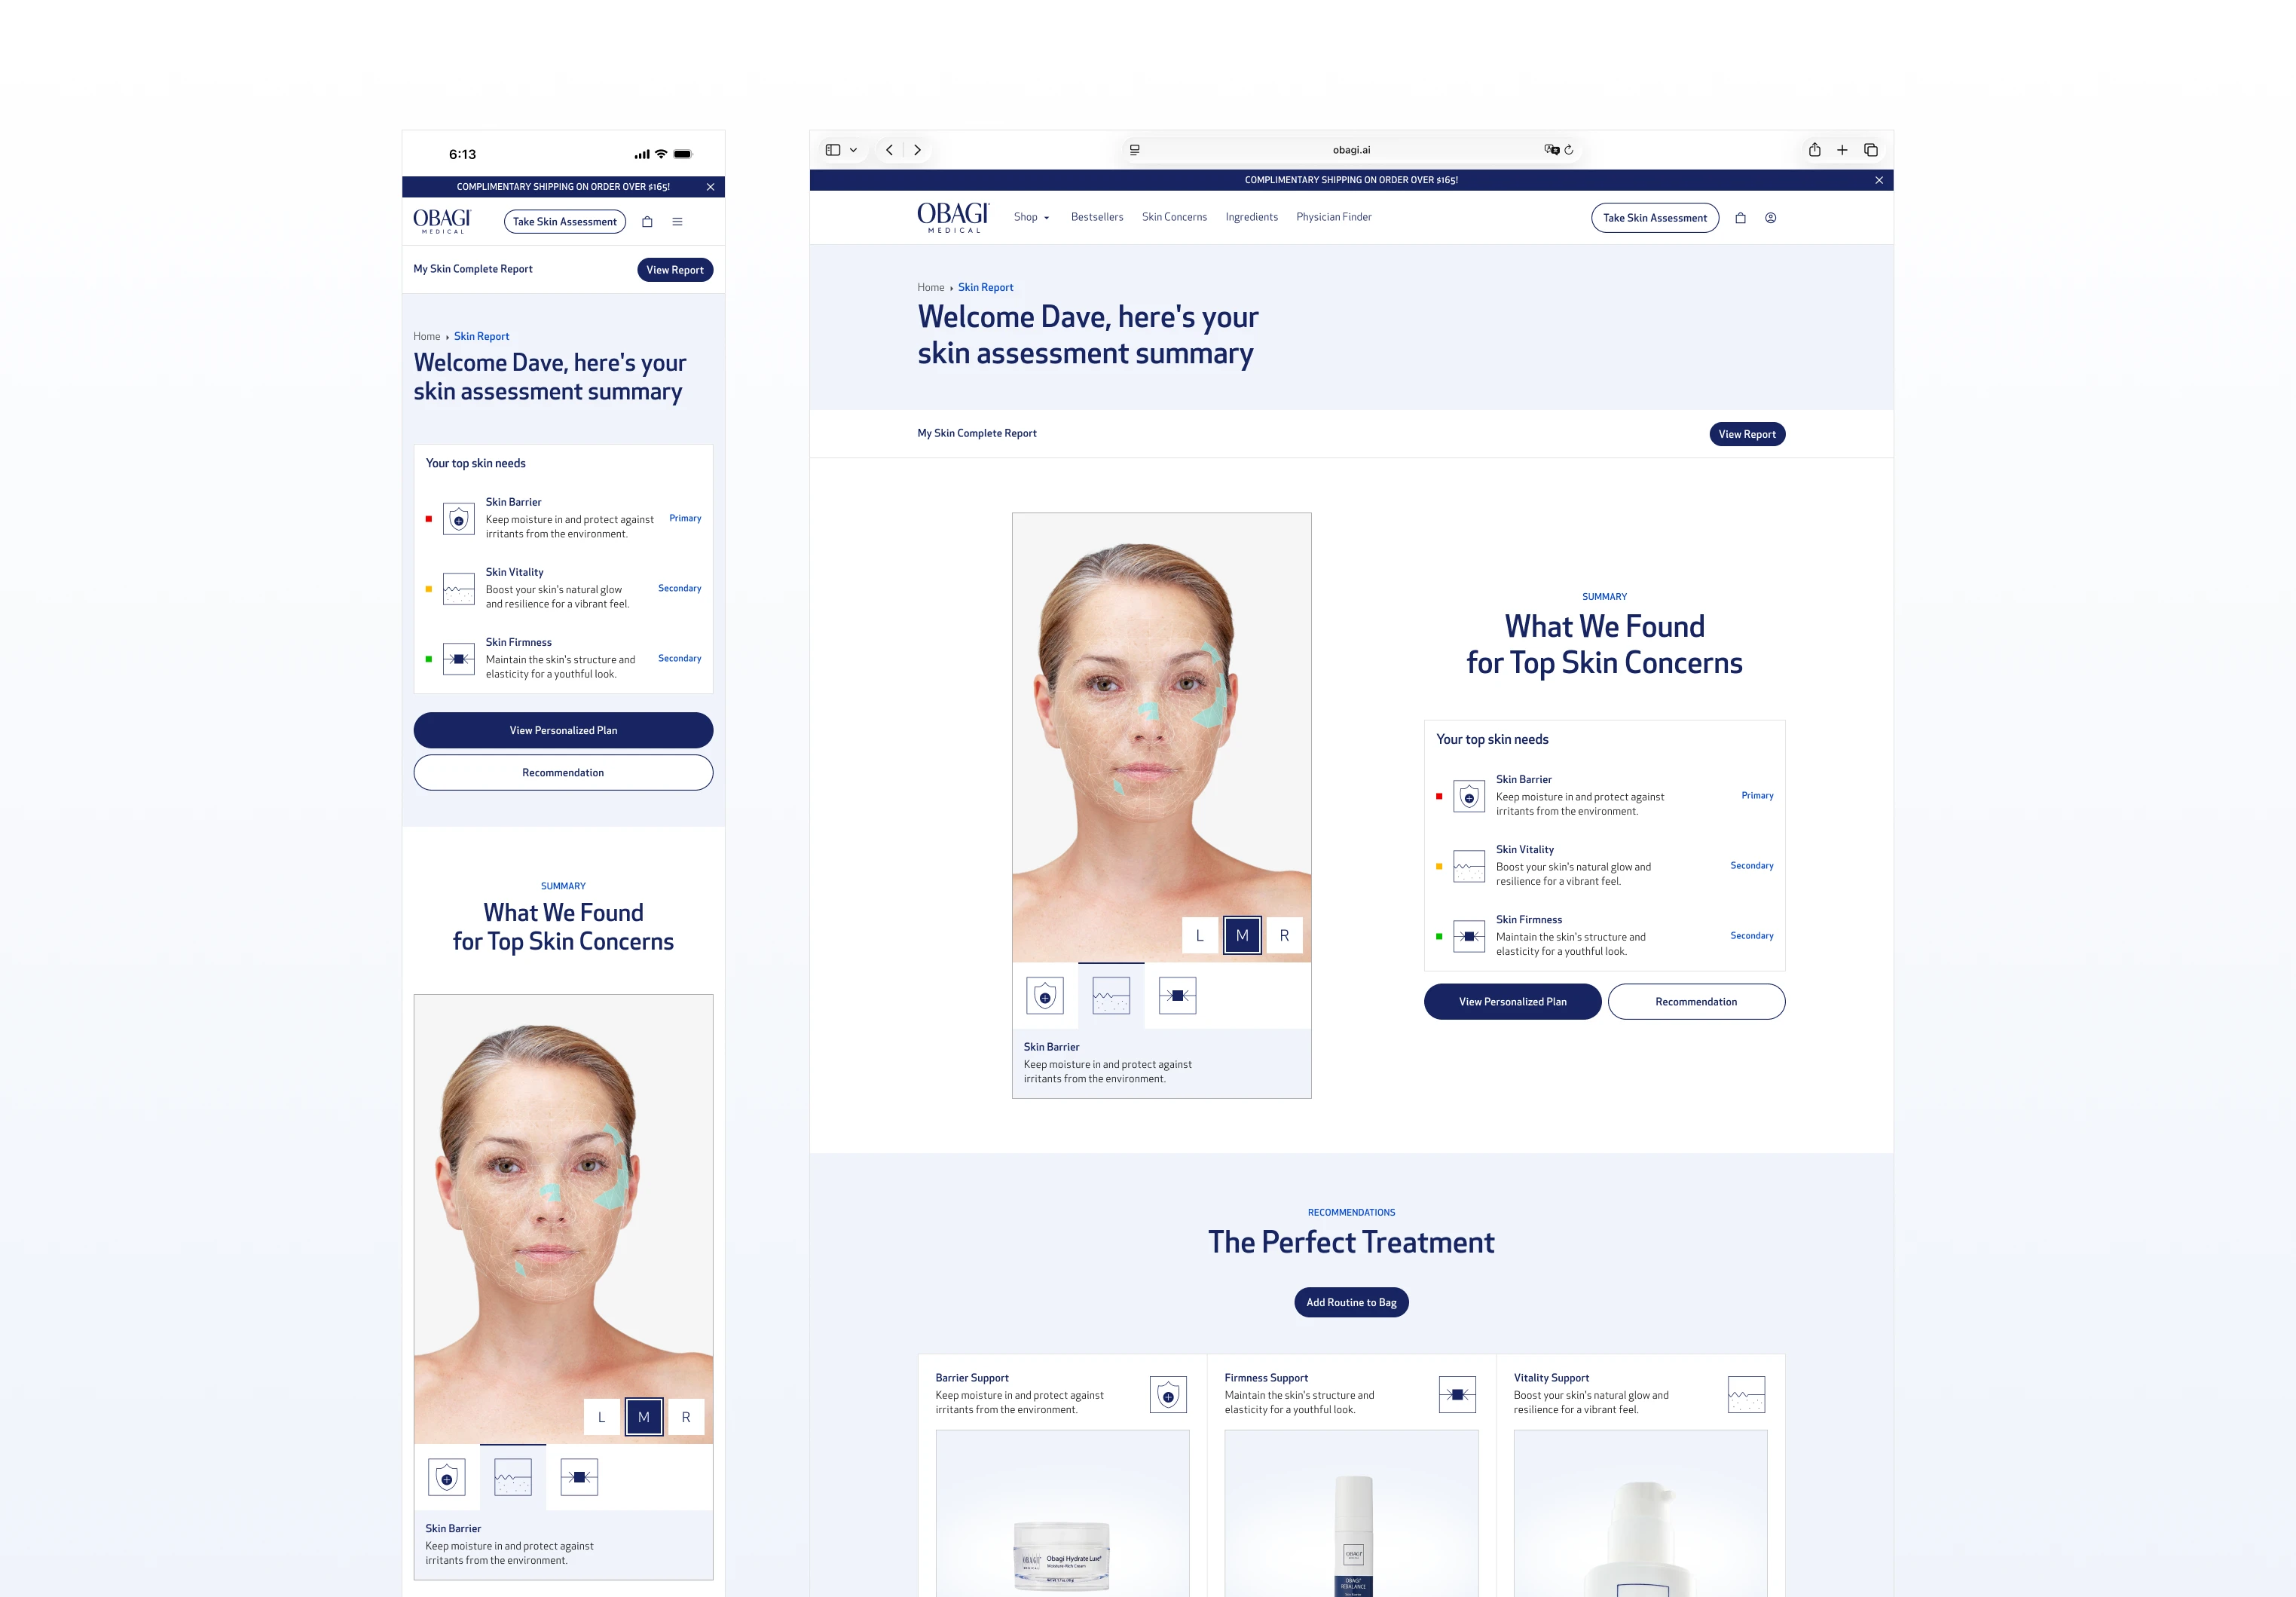
Obagi case study, image 67
Obagi case study, image 68

Vertical Scroll

The story is the primary experience: light on data, heavy on engagement, sequenced to move the user toward conversion. The vertical scroll sits below it as a secondary format: report-forward, more clinical, focused on the summary of findings, product bundling, and a PDF download option for users who want the full data.
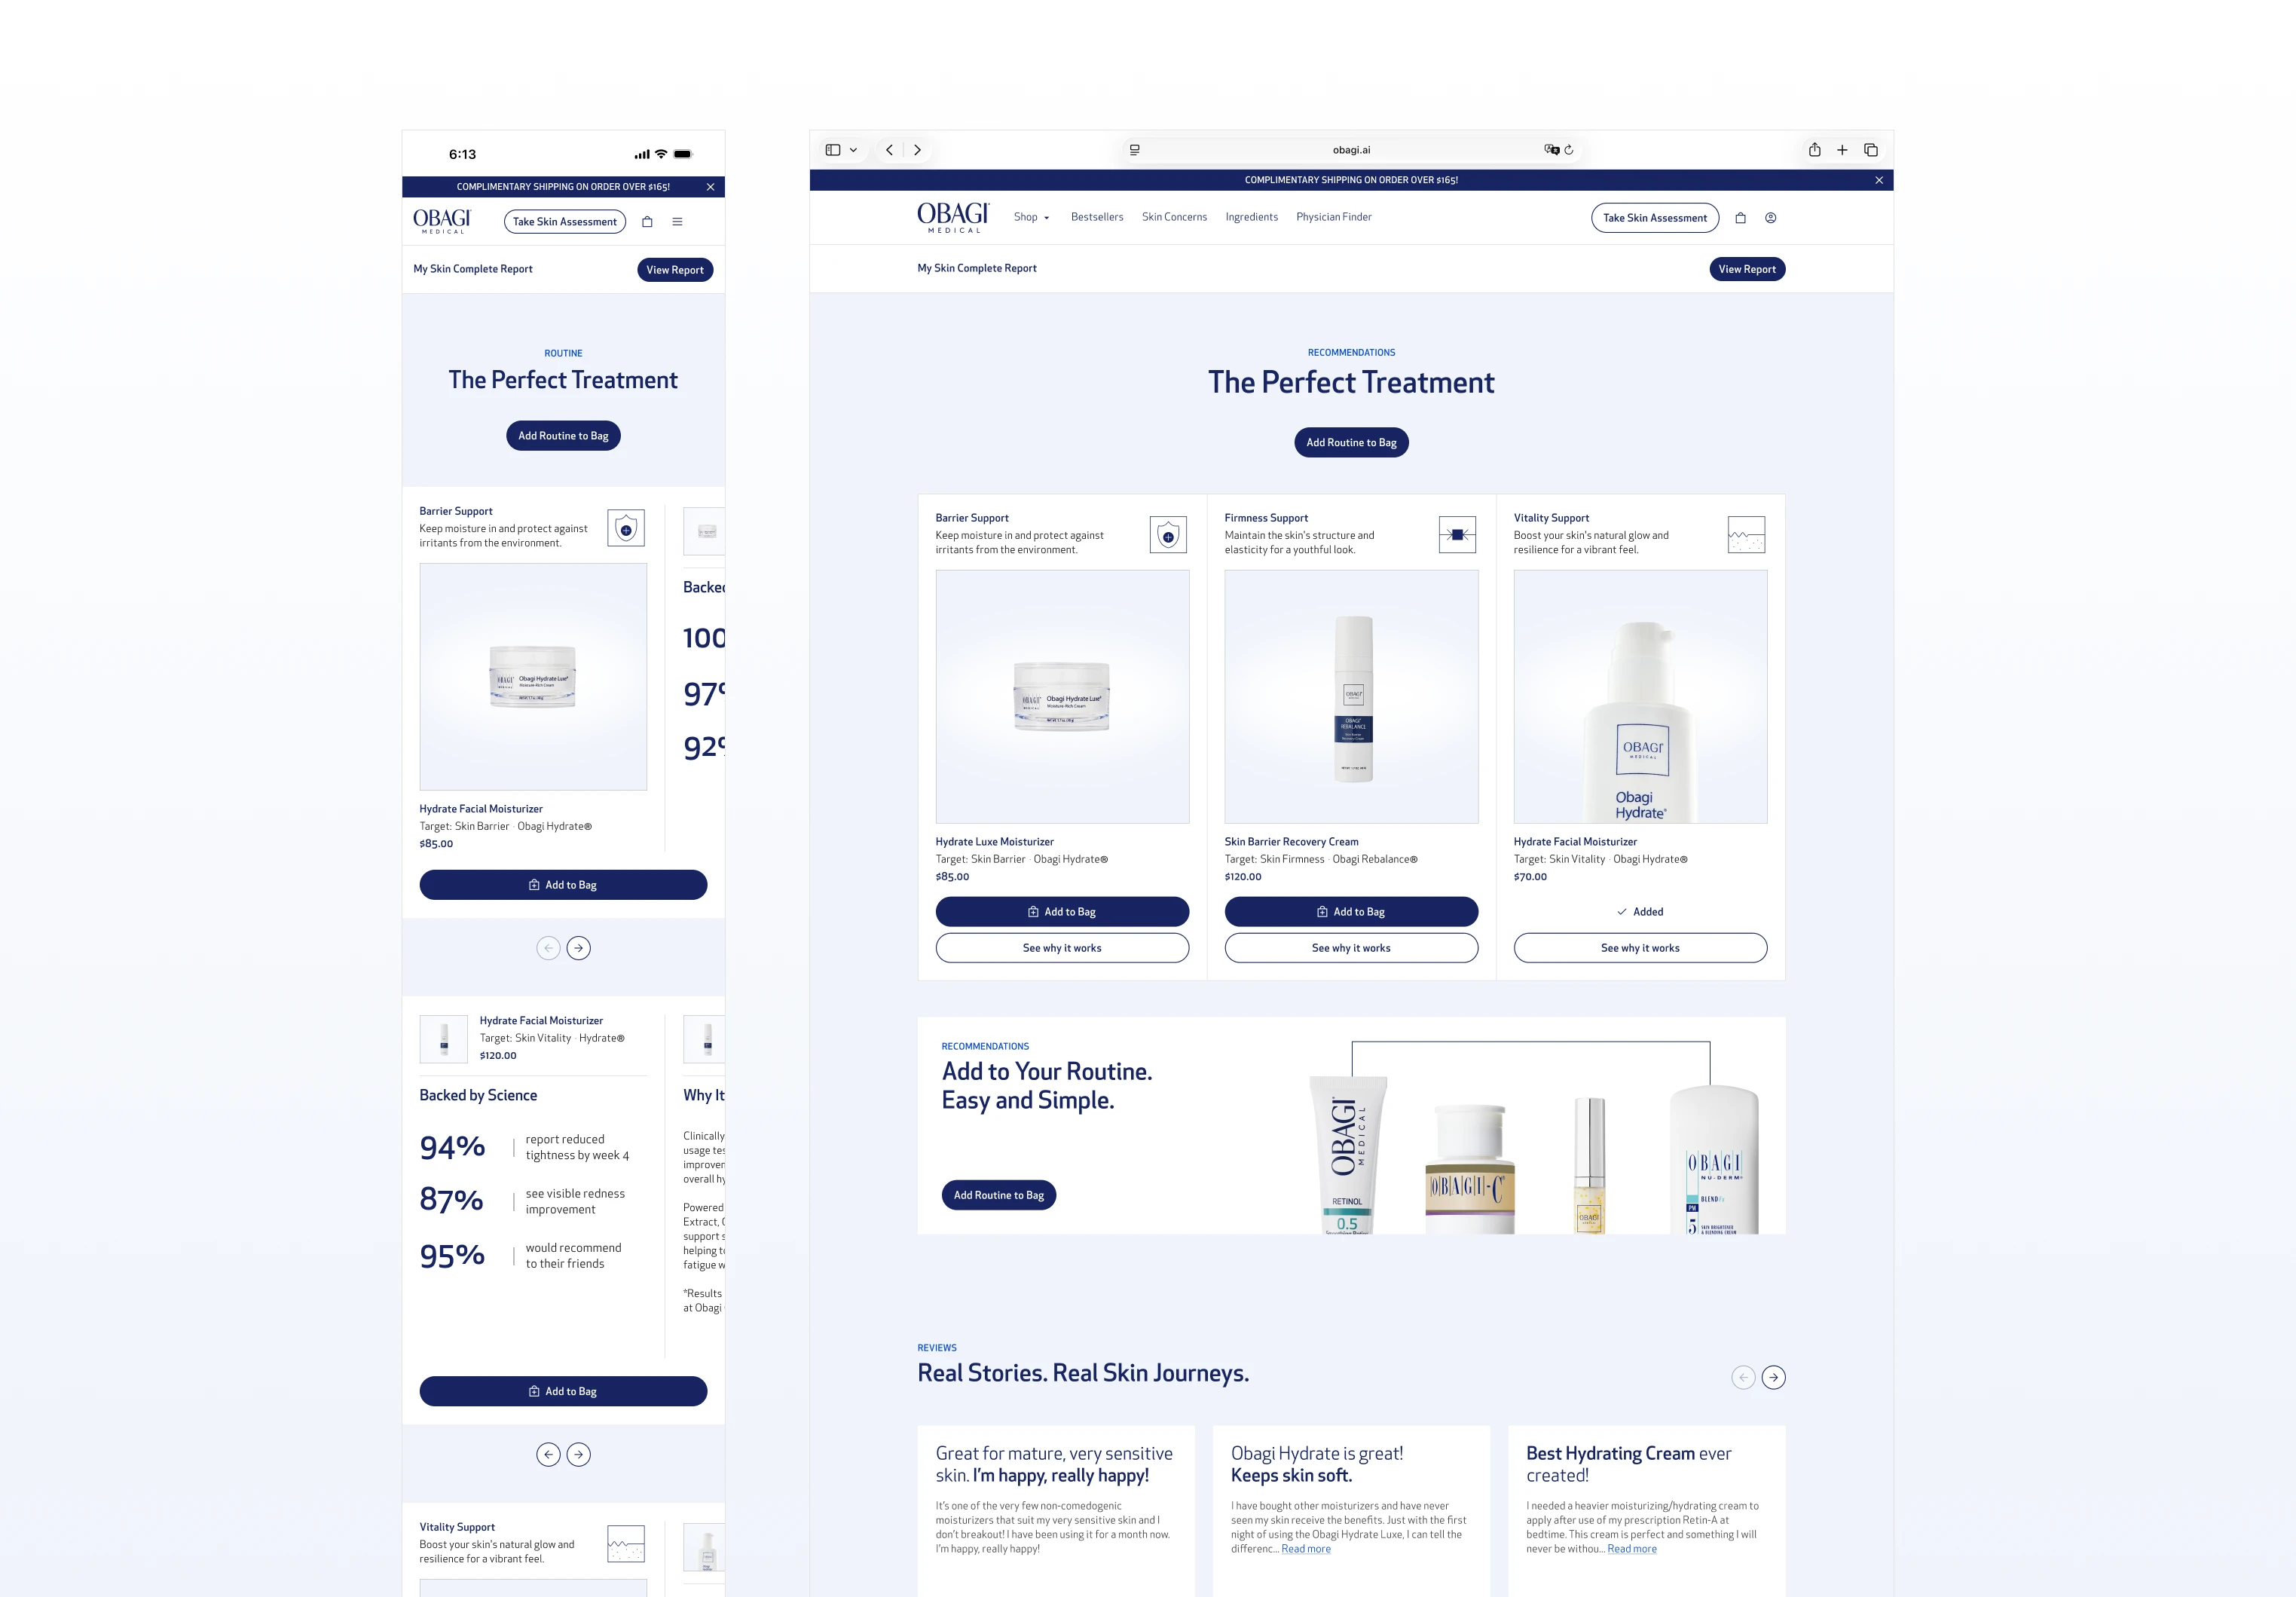
Obagi case study, image 69
Obagi case study, image 70

Vertical Scroll

The vertical scroll was redesigned to be concise. No more competing for attention with the story. Its job is to serve the users who scroll past the story, not to replace it. The skin report data lives there as a sticky button - accessible if you want it, not forced on you if you don't.

Two different users, two different needs, one coherent system.

Reflection

Format is a design decision, not a default.

The biggest thing this project taught me is that the format of information is a design decision, not a default. The vertical scroll wasn't wrong because of its layout, it was wrong because it assumed users wanted to read a report. They didn't. They wanted to know what to do about their skin.

The Spotify Wrapped reference isn't a trick. It works because it respects how people actually process information: in sequence, in moments, with emotional resonance before clinical detail. That logic applies far beyond skincare.

What I'd validate if this had launched: the correction flow. The hypothesis is that gently redirecting a user from their stated concern to what the scan actually found builds more trust than just confirming what they already think. That's a strong assumption and it needed real user testing to confirm. The drop-off rate between the finding screen and the product screen would have been the number to watch.

The project getting sunsetted was a strategic call around dermatologist licensing and legal frameworks - not a design failure. The work reached hi-fi and dev-ready. What remains is a system I'd stand behind, and a format I'd bring to any product that sits at the intersection of personal data and purchase decisions.

Dave Nguyen

Product Designer

Projects

Gallery

Gallery

About

About

Redesigning How Obagi
Delivers Skin Insights

Obagi

·

2025

Back

Back

Back

Role

UX & UI Designer

Team

5 members

Timeline

3 months
June to August 2025

Tools

Figma
FigJam
Rive

Context

This is a 0-to-1 skin scanning experience for a clinical skincare brand.

Obagi is a professional-grade skincare brand known for its clinical authority. This project was a 0-to-1 build: a web-based skin scanning experience where users hold up their camera to scan their face, and the system analyzes their skin data to recommend products tailored to their specific conditions.

Obagi case study, image 1
Obagi case study, image 2

I owned the UX/UI design across the entire experience including the home page, account pages, diagnostic flow, quiz, cart, product detail pages, and the skin report. I built the 200-component design system from scratch, created the user flows, and designed the UX workshops.

Obagi case study, image 3
Obagi case study, image 4

The project was sunsetted before launch due to strategic and legal decisions around the dermatologist layer, not design. The work reached hi-fi, was dev-ready, and was hosted in a staging environment.

This case study focuses on the skin report, the moment after the assessment where users receive their diagnosis and product recommendations.

Obagi case study, image 5
Obagi case study, image 6

Two Entry Points

The experience has two entry points: obagi.ai, and a dedicated section embedded into obagi.com for users who arrive through the existing site. Both lead into the same four-stage flow:

Obagi case study, image 7
Obagi case study, image 8

Skin Assessments Flow

01

Assessment

a 25-question assessment quiz, with a face scan in the middle, breaking up the length and keeping engagement throughout.

02

Diagnosis

the system analyzes the scan data and quiz responses to identify the user's actual skin conditions.

03

Recommendation

the skin report delivers the findings and maps them directly to a personalized product recommendation.

04

Purchase

product recommendations flow directly into cart and checkout, with upsell tied to the user's specific skin findings.

Problem

Nobody reads a skin report and that's a conversion problem.

After completing the face scan and a 25-question skin assessment, users land on their skin report. This is the most important moment in the entire journey, the payoff of everything they just did.

Obagi case study, image 9
Obagi case study, image 10

Skin Quiz & Skin Report

But skin ontology is foreign to most people. Terms like "skin barrier," "transepidermal water loss," or "melanin irregularity" mean nothing without context. And even when explained, a long page of findings creates a new problem: nobody reads it.

Obagi case study, image 11
Obagi case study, image 12

Nobody reads a lengthy clinical report.

If users don't understand their report, they won't trust the recommendation. If they don't trust the recommendation, they won't buy. The report isn't just a UX problem, it's a conversion problem too.

Obagi case study, image 13
Obagi case study, image 14

Competitors' Skin Scan Report

Every major skincare brand with a scan or assessment feature had the same format: a vertical scroll page, clinical findings up top, products below the fold. Long, dense, and structured like a medical document.

The question wasn't how to make that format better. It was whether that format was the right answer at all.

How might we

How might we preserve Obagi's clinical authority while making the skin report engaging enough to drive conversion?

PROCESS

The first two versions got the layout right and the format wrong.

The first version followed the standard pattern. A vertical scroll page with scan results at the hero, skin parameter scores (barrier, firmness, skin tone, texture), strength and focus area breakdowns, and product recommendations below. Clean layout, simple UI, nothing wrong with it technically.

Obagi case study, image 15
Obagi case study, image 16

Vertical Layout: Desktop Iteration

The internal reaction from the Obagi team was calm. When discussing opportunities to enhance the experience, the team had a productive discussion around layout enhancements and how to provide more value without overloading the report.

Obagi case study, image 17
Obagi case study, image 18

Vertical Layout: Desktop Iteration

I was already diagnosing the problem while building the wrong solution.

The core tension that emerged in review: Obagi is a clinical brand. They needed the report to establish authority. To signal that you're not just being sold a product, you're receiving a professional-grade diagnosis. But that same clinical weight was pushing the product recommendation below the fold, burying the most important conversion moment under a wall of findings the user didn't ask for and wouldn't read.

Obagi case study, image 19
Obagi case study, image 20

Vertical Layout: Mobile Iteration

Moving the report down felt like compromising the brand. Keeping it up front hurt the conversion. We iterated through a second version adding more social proof layers - dermatologist quotes, before-and-after sections, testimonials. The page got longer. The tension got worse, especially on mobile

Before committing to any solution, I explored three structural directions:

Tabs

A progressive disclosure pattern that saves space and lets users jump directly to what they care about. If a user only wants the recommendation, they can scroll straight down without reading through the report.

Obagi case study, image 21
Obagi case study, image 22

Iteration #1: Tabs

01

Tabs act as a progressive disclosure pattern, hiding the detailed report by default.

02

With the report hidden, the recommendation section sits above the fold: prioritizing conversion.

03

Recommendations in the Overview tab are mapped to each skin parameter, directly communicating which products target which problems.

04

Each tab represents a scan area, with swipeable parameters to explore individual findings.

05

Each parameter includes annotated scan imagery to visually communicate exactly where the scan was read.

06

Product recommendations remain visible within each tab, narrowed to the concerns specific to that area, keeping conversion prioritized.

Accordions

The same progressive disclosure logic as tabs, but within a scrolling behavior. Users stay in a familiar vertical flow while controlling how much detail they expose.

Obagi case study, image 23
Obagi case study, image 24

Iteration #2: Accordions

01

Accordions collapse the report into expandable rows, pushing recommendations higher without removing the report entirely.

02

Users can expand each row to read the findings, but the pattern works against the experience here. Accordions are designed to hide secondary or familiar content, not critical new information. For a first-time user encountering their report, hiding findings behind a click introduces friction where there should be clarity.

Flashcards

A more engaging and interactive way to reveal information sequentially, while still following the same underlying structure of reporting findings, explaining concerns, and recommending products.

Obagi case study, image 25
Obagi case study, image 26

Iteration #3: Flashcards

01

Swipe-based navigation guides users through the report sequentially, removing decision fatigue. Unlike tabs and accordions, the content reveals itself one step at a time so the user just swipes.

02

Product recommendations are followed by supporting imagery, adding credibility and visual engagement to each finding.

03

Aggregated recommendations sit below the flashcard experience, maintaining conversion focus without interrupting the sequence.

04

The interaction itself carries the experience, making the report feel worth going through rather than worth skipping.

Obagi case study, image 27
Obagi case study, image 28

Iteration #1: Tabs

Tabs and Accordions reduced the visual density but introduced a different problem: they still required the user to decide what to read and when. The decision fatigue didn't go away, it just moved. Flashcards was closer, but it still put the user in control of pacing in a way that felt passive.

None of them resolved the real tension. They just rearranged it.

Insight

Scrolling through Apple Replay changed everything.

It was mid-year. I was scrolling through my Apple Replay monthly report when I remembered how Spotify Wrapped works.

Obagi case study, image 29
Obagi case study, image 30

Spotify Wrapped & Apple Replay

Wrapped takes data (your own listening habits) and delivers it back to you as a story, one moment at a time, in an order that builds to a payoff. You're not reading a report. You're being told something about yourself. It's full-screen, sequenced, and personal. Every frame has one job. Nothing competes.

Obagi case study, image 31
Obagi case study, image 32

Visual Research

That was the aha moment. From there I dived further into similar UX patterns.

How does onboarding work at its best? How does Instagram Stories hold attention without asking for anything? The throughline across all of it: sequential, full-screen, one idea at a time, designed for people who scan rather than read. That became the design reference stack for the skin report.

Obagi case study, image 33
Obagi case study, image 34

Hypothetical Heatmap (by Attention Insights)

Users don't read. They scan. So design for scanning, not reading. And if you want them to stay engaged long enough to reach the product recommendation, give them something worth experiencing - not something worth skipping. That was the moment the story format stopped being a reference and became the answer.

Users come out of a 25-question assessment and a face scan. They've already invested time. They have a stated concern. The system has findings. The job isn't to dump all of that onto a page. The job is to take them on a journey from "here's what you told us" to "here's what we found" to "here's what to do."

Obagi case study, image 35
Obagi case study, image 36

Iterations with New Approach

The reason Spotify Wrapped and Instagram Stories UX patterns answered four problems at once:

Engagement

auto-advancing, animated, full-screen, low users effort.

Attention-grabbing

one idea per frame means the user never has to decide what to focus on. They just tap.

Authority without overwhelm

clinical data can still be there, but sequenced into digestible moments rather than stacked onto a single page.

Uniqueness

no other skincare brand was doing this. Every competitor was still on the same long-scroll report format. A story-driven skin report was a genuine differentiator, not just a UX improvement.

Obagi case study, image 37
Obagi case study, image 38

Draft Story Pattern Layout

And critically, the format is already familiar. Users know how Wrapped and Stories work. No learning curve, no friction, no cognitive load spent figuring out the interaction. They just experience it.

That's exactly what the skin report needed to do.

Solution

A story format that sequences data the way people actually consume content.

The story functions like an Instagram Story: full-screen, tap left or right to navigate, auto-advancing with animation. No scrolling required. The user stays in the experience rather than managing a page.

Obagi case study, image 39
Obagi case study, image 40

The Finals

The sequence was designed with a specific logic:

Obagi case study, image 41
Obagi case study, image 42

Welcome Screens

Welcome screen

It opens with the user's stated skin concern from the quiz. Immediate relevance. You see yourself in the first frame.

Obagi case study, image 43
Obagi case study, image 44

Analysis Screen

Analysis screen

An engagement moment showing Obagi processing the scan data. Builds anticipation, establishes clinical authority without a word of jargon.

Obagi case study, image 45
Obagi case study, image 46

Concerns Screen

Primary and secondary concern screens

This explains each finding in plain language, matched to the scan data, not the user's self-diagnosis.

Obagi case study, image 47
Obagi case study, image 48

Findings Screens

Findings screen

This is the validation or correction point. If the scan confirms what the user suspected, the copy validates them. If the findings differ from their stated concern, the copy gently corrects: "We understand you're concerned about skin firmness, but your scan shows a skin barrier issue." Two different story arcs, same screen structure.

The core tension: how much clinical detail is enough to build trust without breaking the story's momentum.

01

Primary clinical findings aggregated into a scrollable screen, intended to lessen the clinical weight by consolidating everything in one place. Rejected because scrolling inside a tap-only experience creates a broken interaction model.

02

Clinical detail condensed into a bottom sheet using progressive disclosure. Rejected for two reasons: it introduced a new tap behavior competing with the story mechanic, and fast tappers would skip past it entirely. The clinical depth already had a home in the PDF sent after the scan.

03

All three skin concerns connected through copy, storytelling, and visual design to communicate that the findings are linked, not isolated. Compelling in concept, but required reading to land. Too much to ask mid-story.

04

This is the final version. Consumer-focused headline, scan image, short clinical body copy. Enough to build trust in the finding without slowing the user down.

Obagi case study, image 49
Obagi case study, image 50

Product Connection Screen

Product connection screen

Animation showing the three concerns with arrows pointing to the products that address each one. Visual, scannable, no clinical language needed.

Obagi case study, image 51
Obagi case study, image 52

Product Showcase Screens

Product showcase

The product itself, price, and one effectiveness number. Clean. Not a product detail page. The core tension: how much to show without overwhelming, while still converting.

01

Forced bundle, all products packaged together with no individual choice. Rejected because accommodating all products in one screen reintroduced information overload, and removing user control felt more pushy than consultative.

02

All products listed on one screen, individually selectable. User control was there, but the screen became dense and story momentum stalled.

03

This is the final version. One product per screen, full-bleed image, the skin concern it targets, price, and a single "Add to Bag" button. One product, one screen, one decision. An aggregated bundle screen follows at the end for users ready to add everything in one tap.

Obagi case study, image 53
Obagi case study, image 54

Social Proof Screens

Social proof trilogy

Dermatologist quote, before & after, clinical data. Three separate screens, each focused on one trust signal rather than stacking them.

Obagi case study, image 55
Obagi case study, image 56

Aggregate & Add to Bag Screens

Aggregate and add to bag

All recommended products listed, individual "Add to Bag" buttons, and an "Add All" option for the user who's ready to commit. The core tension: what to pair with the add to bag action to increase conversion without pulling focus from it.

01

Before and after image paired with the product list. Social proof right before the purchase decision should reduce hesitation, but the visual weight of the before and after pulled attention away from the products and the CTA entirely.

02

Products only, as a vertical list or a carousel. Both are clean and focused with nothing competing with the add to bag action. Both versions kept and marked for A/B testing in a later phase.

Obagi case study, image 57
Obagi case study, image 58

Confirmation Screen

Confirmation screen

A closing moment affirming the decision. Sends the user to checkout with confidence rather than hesitation.

Obagi case study, image 59
Obagi case study, image 60

The Sequence Logic

The sequence logic was intentional: validate before selling, explain before recommending, build trust before asking for the transaction. Every screen has one job. Nothing competes.

Storytelling

The story only works if it speaks to the user, not at them.

The first iteration of the story format had copy, but it was direct and clinical. Just the sequence: here is what we found, here is the product. No acknowledgment of what the user came in believing, no emotional thread connecting the diagnosis to the recommendation. The team liked the concept, but the internal crit was clear: it felt like a showcase, not a story. There was no emotional bond between the user and the experience.

Obagi case study, image 61
Obagi case study, image 62

Iterations First Copy

That feedback sent me back to the quiz.

Inside the assessment, users select their stated skin concern, what they already believe is their problem. That's a significant signal. A user who selects "skin barrier" is telling you something about how they see themselves and what they came here to fix. When the scan runs and the findings come back, two things can happen: the scan confirms what they suspected, or it finds something different.

Obagi case study, image 63
Obagi case study, image 64

Quiz to Narrative

If you ignore that distinction and just present the findings as facts, you create friction. The user arrived with a belief. The screen contradicts it without acknowledgment. That gap between what they think and what the scan found is exactly where trust breaks down.

Think about a real dermatologist visit. You walk in with a stated concern. The doctor listens, runs their assessment, and then talks you through what they found - whether it confirms what you suspected or surfaces something new. They never just hand you a diagnosis and walk out. The conversation is part of the experience. That's what the copy needed to replicate: a system that feels like it's talking to you, not at you.

This also directly mirrors the authority that Obagi embodies as a brand. They are a clinically backed, dermatologist-trusted brand. The story format needed to reflect that same standard: knowledgeable, consultative, and personal.

Obagi case study, image 65
Obagi case study, image 66

New Copy Arcs Applied

The solution (called Concern-Centered Narrative Assembly) was two story arcs (selected from four) with identical screen structures but different copy:

Validation flow

When the scan confirms the user's stated concern, the copy acknowledges it. "Your instinct was right. Here's what we found." The user feels seen, not sold to.

Correction flow

When the scan finds something different, the copy meets them where they are before redirecting. It acknowledges what they care about first, then introduces the finding as new information rather than a contradiction. "We know you're focused on skin firmness. Your scan also shows a skin barrier issue that's worth addressing."

The tone never tells the user they are wrong. It treats the mismatch as a discovery, not a correction. The brand voice came from Obagi's copy team, but the structural logic (acknowledge first, redirect second) came from understanding where the emotional friction lived.

This was the detail that turned a clinical showcase into a conversation.

Decision

The vertical scroll stayed - because two users have two different needs.

The story format solved the engagement problem. But it created a new one.

Users coming from other skincare brands expect a report. If they've used Cetaphil's skin assessment or any competitor tool, they're conditioned to a vertical scroll. Replacing the report entirely with a story format would confuse them. It would also sacrifice the vertical real estate that still works for certain users, the ones who want to read, who trust clinical detail, who want to understand before they buy.

The solution was to keep both.

Obagi case study, image 67
Obagi case study, image 68

Vertical Scroll

The story is the primary experience: light on data, heavy on engagement, sequenced to move the user toward conversion. The vertical scroll sits below it as a secondary format: report-forward, more clinical, focused on the summary of findings, product bundling, and a PDF download option for users who want the full data.

Obagi case study, image 69
Obagi case study, image 70

Vertical Scroll

The vertical scroll was redesigned to be concise. No more competing for attention with the story. Its job is to serve the users who scroll past the story, not to replace it. The skin report data lives there as a sticky button - accessible if you want it, not forced on you if you don't.

Two different users, two different needs, one coherent system.

Reflection

Format is a design decision, not a default.

The biggest thing this project taught me is that the format of information is a design decision, not a default. The vertical scroll wasn't wrong because of its layout, it was wrong because it assumed users wanted to read a report. They didn't. They wanted to know what to do about their skin.

The Spotify Wrapped reference isn't a trick. It works because it respects how people actually process information: in sequence, in moments, with emotional resonance before clinical detail. That logic applies far beyond skincare.

What I'd validate if this had launched: the correction flow. The hypothesis is that gently redirecting a user from their stated concern to what the scan actually found builds more trust than just confirming what they already think. That's a strong assumption and it needed real user testing to confirm. The drop-off rate between the finding screen and the product screen would have been the number to watch.

The project getting sunsetted was a strategic call around dermatologist licensing and legal frameworks - not a design failure. The work reached hi-fi and dev-ready. What remains is a system I'd stand behind, and a format I'd bring to any product that sits at the intersection of personal data and purchase decisions.

Dave Nguyen

Product Designer

Projects

Gallery

Gallery

About

About

Redesigning How Obagi Delivers Skin Insights

Obagi

·

2025

Role

UX & UI Designer

Team

5 members

Timeline

3 months
June to August 2025

Tools

Figma
FigJam
Rive

Context

This is a 0-to-1 skin scanning experience for a clinical skincare brand.

Obagi is a professional-grade skincare brand known for its clinical authority. This project was a 0-to-1 build: a web-based skin scanning experience where users hold up their camera to scan their face, and the system analyzes their skin data to recommend products tailored to their specific conditions.

Obagi case study, image 1
Obagi case study, image 2

I owned the UX/UI design across the entire experience including the home page, account pages, diagnostic flow, quiz, cart, product detail pages, and the skin report. I built the 200-component design system from scratch, created the user flows, and designed the UX workshops.

Obagi case study, image 3
Obagi case study, image 4

The project was sunsetted before launch due to strategic and legal decisions around the dermatologist layer, not design. The work reached hi-fi, was dev-ready, and was hosted in a staging environment.

This case study focuses on the skin report, the moment after the assessment where users receive their diagnosis and product recommendations.

Obagi case study, image 5
Obagi case study, image 6

Two Entry Points

The experience has two entry points: obagi.ai, and a dedicated section embedded into obagi.com for users who arrive through the existing site. Both lead into the same four-stage flow:

Obagi case study, image 7
Obagi case study, image 8

Skin Assessments Flow

01

Assessment

a 25-question assessment quiz, with a face scan in the middle, breaking up the length and keeping engagement throughout.

02

Diagnosis

the system analyzes the scan data and quiz responses to identify the user's actual skin conditions.

03

Recommendation

the skin report delivers the findings and maps them directly to a personalized product recommendation.

04

Purchase

product recommendations flow directly into cart and checkout, with upsell tied to the user's specific skin findings.

Problem

Nobody reads a skin report and that's a conversion problem.

After completing the face scan and a 25-question skin assessment, users land on their skin report. This is the most important moment in the entire journey, the payoff of everything they just did.

Obagi case study, image 9
Obagi case study, image 10

Skin Quiz & Skin Report

But skin ontology is foreign to most people. Terms like "skin barrier," "transepidermal water loss," or "melanin irregularity" mean nothing without context. And even when explained, a long page of findings creates a new problem: nobody reads it.

Obagi case study, image 11
Obagi case study, image 12

Nobody reads a lengthy clinical report.

If users don't understand their report, they won't trust the recommendation. If they don't trust the recommendation, they won't buy. The report isn't just a UX problem, it's a conversion problem too.

Obagi case study, image 13
Obagi case study, image 14

Competitors' Skin Scan Report

Every major skincare brand with a scan or assessment feature had the same format: a vertical scroll page, clinical findings up top, products below the fold. Long, dense, and structured like a medical document.

The question wasn't how to make that format better. It was whether that format was the right answer at all.

How might we

How might we preserve Obagi's clinical authority while making the skin report engaging enough to drive conversion?

PROCESS

The first two versions got the layout right and the format wrong.

The first version followed the standard pattern. A vertical scroll page with scan results at the hero, skin parameter scores (barrier, firmness, skin tone, texture), strength and focus area breakdowns, and product recommendations below. Clean layout, simple UI, nothing wrong with it technically.

Obagi case study, image 15
Obagi case study, image 16

Vertical Layout: Desktop Iteration

The internal reaction from the Obagi team was calm. When discussing opportunities to enhance the experience, the team had a productive discussion around layout enhancements and how to provide more value without overloading the report.

Obagi case study, image 17
Obagi case study, image 18

Vertical Layout: Desktop Iteration

I was already diagnosing the problem while building the wrong solution.

The core tension that emerged in review: Obagi is a clinical brand. They needed the report to establish authority. To signal that you're not just being sold a product, you're receiving a professional-grade diagnosis. But that same clinical weight was pushing the product recommendation below the fold, burying the most important conversion moment under a wall of findings the user didn't ask for and wouldn't read.

Obagi case study, image 19
Obagi case study, image 20

Vertical Layout: Mobile Iteration

Moving the report down felt like compromising the brand. Keeping it up front hurt the conversion. We iterated through a second version adding more social proof layers - dermatologist quotes, before-and-after sections, testimonials. The page got longer. The tension got worse, especially on mobile

Before committing to any solution, I explored three structural directions:

Tabs

A progressive disclosure pattern that saves space and lets users jump directly to what they care about. If a user only wants the recommendation, they can scroll straight down without reading through the report.

Obagi case study, image 21
Obagi case study, image 22

Iteration #1: Tabs

01

Tabs act as a progressive disclosure pattern, hiding the detailed report by default.

02

With the report hidden, the recommendation section sits above the fold: prioritizing conversion.

03

Recommendations in the Overview tab are mapped to each skin parameter, directly communicating which products target which problems.

04

Each tab represents a scan area, with swipeable parameters to explore individual findings.

05

Each parameter includes annotated scan imagery to visually communicate exactly where the scan was read.

06

Product recommendations remain visible within each tab, narrowed to the concerns specific to that area, keeping conversion prioritized.

Accordions

The same progressive disclosure logic as tabs, but within a scrolling behavior. Users stay in a familiar vertical flow while controlling how much detail they expose.

Obagi case study, image 23
Obagi case study, image 24

Iteration #2: Accordions

01

Accordions collapse the report into expandable rows, pushing recommendations higher without removing the report entirely.

02

Users can expand each row to read the findings, but the pattern works against the experience here. Accordions are designed to hide secondary or familiar content, not critical new information. For a first-time user encountering their report, hiding findings behind a click introduces friction where there should be clarity.

Flashcards

A more engaging and interactive way to reveal information sequentially, while still following the same underlying structure of reporting findings, explaining concerns, and recommending products.

Obagi case study, image 25
Obagi case study, image 26

Iteration #3: Flashcards

01

Swipe-based navigation guides users through the report sequentially, removing decision fatigue. Unlike tabs and accordions, the content reveals itself one step at a time so the user just swipes.

02

Product recommendations are followed by supporting imagery, adding credibility and visual engagement to each finding.

03

Aggregated recommendations sit below the flashcard experience, maintaining conversion focus without interrupting the sequence.

04

The interaction itself carries the experience, making the report feel worth going through rather than worth skipping.

Obagi case study, image 27
Obagi case study, image 28

Iteration #1: Tabs

Tabs and Accordions reduced the visual density but introduced a different problem: they still required the user to decide what to read and when. The decision fatigue didn't go away, it just moved. Flashcards was closer, but it still put the user in control of pacing in a way that felt passive.

None of them resolved the real tension. They just rearranged it.

Insight

Scrolling through Apple Replay changed everything.

It was mid-year. I was scrolling through my Apple Replay monthly report when I remembered how Spotify Wrapped works.

Obagi case study, image 29
Obagi case study, image 30

Spotify Wrapped & Apple Replay

Wrapped takes data (your own listening habits) and delivers it back to you as a story, one moment at a time, in an order that builds to a payoff. You're not reading a report. You're being told something about yourself. It's full-screen, sequenced, and personal. Every frame has one job. Nothing competes.

Obagi case study, image 31
Obagi case study, image 32

Visual Research

That was the aha moment. From there I dived further into similar UX patterns.

How does onboarding work at its best? How does Instagram Stories hold attention without asking for anything? The throughline across all of it: sequential, full-screen, one idea at a time, designed for people who scan rather than read. That became the design reference stack for the skin report.

Obagi case study, image 33
Obagi case study, image 34

Hypothetical Heatmap (by Attention Insights)

Users don't read. They scan. So design for scanning, not reading. And if you want them to stay engaged long enough to reach the product recommendation, give them something worth experiencing - not something worth skipping. That was the moment the story format stopped being a reference and became the answer.

Users come out of a 25-question assessment and a face scan. They've already invested time. They have a stated concern. The system has findings. The job isn't to dump all of that onto a page. The job is to take them on a journey from "here's what you told us" to "here's what we found" to "here's what to do."

Obagi case study, image 35
Obagi case study, image 36

Iterations with New Approach

The reason Spotify Wrapped and Instagram Stories UX patterns answered four problems at once:

Engagement

auto-advancing, animated, full-screen, low users effort.

Attention-grabbing

one idea per frame means the user never has to decide what to focus on. They just tap.

Authority without overwhelm

clinical data can still be there, but sequenced into digestible moments rather than stacked onto a single page.

Uniqueness

no other skincare brand was doing this. Every competitor was still on the same long-scroll report format. A story-driven skin report was a genuine differentiator, not just a UX improvement.

Obagi case study, image 37
Obagi case study, image 38

Draft Story Pattern Layout

And critically, the format is already familiar. Users know how Wrapped and Stories work. No learning curve, no friction, no cognitive load spent figuring out the interaction. They just experience it.

That's exactly what the skin report needed to do.

Solution

A story format that sequences data the way people actually consume content.

The story functions like an Instagram Story: full-screen, tap left or right to navigate, auto-advancing with animation. No scrolling required. The user stays in the experience rather than managing a page.

Obagi case study, image 39
Obagi case study, image 40

The Finals

The sequence was designed with a specific logic:

Obagi case study, image 41
Obagi case study, image 42

Welcome Screens

Welcome screen

It opens with the user's stated skin concern from the quiz. Immediate relevance. You see yourself in the first frame.

Obagi case study, image 43
Obagi case study, image 44

Analysis Screen

Analysis screen

An engagement moment showing Obagi processing the scan data. Builds anticipation, establishes clinical authority without a word of jargon.

Obagi case study, image 45
Obagi case study, image 46

Concerns Screen

Primary and secondary concern screens

This explains each finding in plain language, matched to the scan data, not the user's self-diagnosis.

Obagi case study, image 47
Obagi case study, image 48

Findings Screens

Findings screen

This is the validation or correction point. If the scan confirms what the user suspected, the copy validates them. If the findings differ from their stated concern, the copy gently corrects: "We understand you're concerned about skin firmness, but your scan shows a skin barrier issue." Two different story arcs, same screen structure.

The core tension: how much clinical detail is enough to build trust without breaking the story's momentum.

01

Primary clinical findings aggregated into a scrollable screen, intended to lessen the clinical weight by consolidating everything in one place. Rejected because scrolling inside a tap-only experience creates a broken interaction model.

02

Clinical detail condensed into a bottom sheet using progressive disclosure. Rejected for two reasons: it introduced a new tap behavior competing with the story mechanic, and fast tappers would skip past it entirely. The clinical depth already had a home in the PDF sent after the scan.

03

All three skin concerns connected through copy, storytelling, and visual design to communicate that the findings are linked, not isolated. Compelling in concept, but required reading to land. Too much to ask mid-story.

04

This is the final version. Consumer-focused headline, scan image, short clinical body copy. Enough to build trust in the finding without slowing the user down.

Obagi case study, image 49
Obagi case study, image 50

Product Connection Screen

Product connection screen

Animation showing the three concerns with arrows pointing to the products that address each one. Visual, scannable, no clinical language needed.

Obagi case study, image 51
Obagi case study, image 52

Product Showcase Screens

Product showcase

The product itself, price, and one effectiveness number. Clean. Not a product detail page. The core tension: how much to show without overwhelming, while still converting.

01

Forced bundle, all products packaged together with no individual choice. Rejected because accommodating all products in one screen reintroduced information overload, and removing user control felt more pushy than consultative.

02

All products listed on one screen, individually selectable. User control was there, but the screen became dense and story momentum stalled.

03

This is the final version. One product per screen, full-bleed image, the skin concern it targets, price, and a single "Add to Bag" button. One product, one screen, one decision. An aggregated bundle screen follows at the end for users ready to add everything in one tap.

Obagi case study, image 53
Obagi case study, image 54

Social Proof Screens

Social proof trilogy

Dermatologist quote, before & after, clinical data. Three separate screens, each focused on one trust signal rather than stacking them.

Obagi case study, image 55
Obagi case study, image 56

Aggregate & Add to Bag Screens

Aggregate and add to bag

All recommended products listed, individual "Add to Bag" buttons, and an "Add All" option for the user who's ready to commit. The core tension: what to pair with the add to bag action to increase conversion without pulling focus from it.

01

Before and after image paired with the product list. Social proof right before the purchase decision should reduce hesitation, but the visual weight of the before and after pulled attention away from the products and the CTA entirely.

02

Products only, as a vertical list or a carousel. Both are clean and focused with nothing competing with the add to bag action. Both versions kept and marked for A/B testing in a later phase.

Obagi case study, image 57
Obagi case study, image 58

Confirmation Screen

Confirmation screen

A closing moment affirming the decision. Sends the user to checkout with confidence rather than hesitation.

Obagi case study, image 59
Obagi case study, image 60

The Sequence Logic

The sequence logic was intentional: validate before selling, explain before recommending, build trust before asking for the transaction. Every screen has one job. Nothing competes.

Storytelling

The story only works if it speaks to the user, not at them.

The first iteration of the story format had copy, but it was direct and clinical. Just the sequence: here is what we found, here is the product. No acknowledgment of what the user came in believing, no emotional thread connecting the diagnosis to the recommendation. The team liked the concept, but the internal crit was clear: it felt like a showcase, not a story. There was no emotional bond between the user and the experience.

Obagi case study, image 61
Obagi case study, image 62

Iterations First Copy

That feedback sent me back to the quiz.

Inside the assessment, users select their stated skin concern, what they already believe is their problem. That's a significant signal. A user who selects "skin barrier" is telling you something about how they see themselves and what they came here to fix. When the scan runs and the findings come back, two things can happen: the scan confirms what they suspected, or it finds something different.

Obagi case study, image 63
Obagi case study, image 64

Quiz to Narrative

If you ignore that distinction and just present the findings as facts, you create friction. The user arrived with a belief. The screen contradicts it without acknowledgment. That gap between what they think and what the scan found is exactly where trust breaks down.

Think about a real dermatologist visit. You walk in with a stated concern. The doctor listens, runs their assessment, and then talks you through what they found - whether it confirms what you suspected or surfaces something new. They never just hand you a diagnosis and walk out. The conversation is part of the experience. That's what the copy needed to replicate: a system that feels like it's talking to you, not at you.

This also directly mirrors the authority that Obagi embodies as a brand. They are a clinically backed, dermatologist-trusted brand. The story format needed to reflect that same standard: knowledgeable, consultative, and personal.

Obagi case study, image 65
Obagi case study, image 66

New Copy Arcs Applied

The solution (called Concern-Centered Narrative Assembly) was two story arcs (selected from four) with identical screen structures but different copy:

Validation flow

When the scan confirms the user's stated concern, the copy acknowledges it. "Your instinct was right. Here's what we found." The user feels seen, not sold to.

Correction flow

When the scan finds something different, the copy meets them where they are before redirecting. It acknowledges what they care about first, then introduces the finding as new information rather than a contradiction. "We know you're focused on skin firmness. Your scan also shows a skin barrier issue that's worth addressing."

The tone never tells the user they are wrong. It treats the mismatch as a discovery, not a correction. The brand voice came from Obagi's copy team, but the structural logic (acknowledge first, redirect second) came from understanding where the emotional friction lived.

This was the detail that turned a clinical showcase into a conversation.

Decision

The vertical scroll stayed - because two users have two different needs.

The story format solved the engagement problem. But it created a new one.

Users coming from other skincare brands expect a report. If they've used Cetaphil's skin assessment or any competitor tool, they're conditioned to a vertical scroll. Replacing the report entirely with a story format would confuse them. It would also sacrifice the vertical real estate that still works for certain users, the ones who want to read, who trust clinical detail, who want to understand before they buy.

The solution was to keep both.

Obagi case study, image 67
Obagi case study, image 68

Vertical Scroll

The story is the primary experience: light on data, heavy on engagement, sequenced to move the user toward conversion. The vertical scroll sits below it as a secondary format: report-forward, more clinical, focused on the summary of findings, product bundling, and a PDF download option for users who want the full data.

Obagi case study, image 69
Obagi case study, image 70

Vertical Scroll

The vertical scroll was redesigned to be concise. No more competing for attention with the story. Its job is to serve the users who scroll past the story, not to replace it. The skin report data lives there as a sticky button - accessible if you want it, not forced on you if you don't.

Two different users, two different needs, one coherent system.

Reflection

Format is a design decision, not a default.

The biggest thing this project taught me is that the format of information is a design decision, not a default. The vertical scroll wasn't wrong because of its layout, it was wrong because it assumed users wanted to read a report. They didn't. They wanted to know what to do about their skin.

The Spotify Wrapped reference isn't a trick. It works because it respects how people actually process information: in sequence, in moments, with emotional resonance before clinical detail. That logic applies far beyond skincare.

What I'd validate if this had launched: the correction flow. The hypothesis is that gently redirecting a user from their stated concern to what the scan actually found builds more trust than just confirming what they already think. That's a strong assumption and it needed real user testing to confirm. The drop-off rate between the finding screen and the product screen would have been the number to watch.

The project getting sunsetted was a strategic call around dermatologist licensing and legal frameworks - not a design failure. The work reached hi-fi and dev-ready. What remains is a system I'd stand behind, and a format I'd bring to any product that sits at the intersection of personal data and purchase decisions.